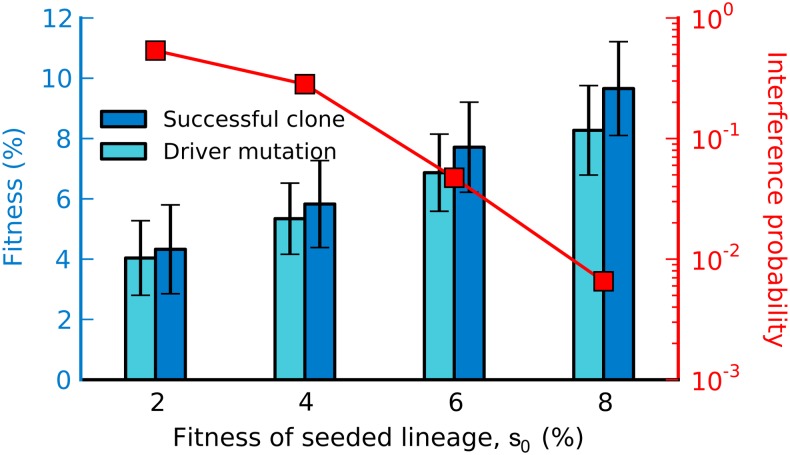
Figure 7.
A screen for beneficial mutations. We simulated the evolutionary dynamics for a range of seeded lineages and then simulated picking a single clone at random from the resident population immediately after a clonal interference event. The bars indicate the average fitness of this clone and its largest effect mutation (±1 SD, scale at left). We also show the fraction of replicate populations in our simulations in which clonal interference occurs (scale at right). The simulations assumed the most-likely exponential DFE inferred in the study.

