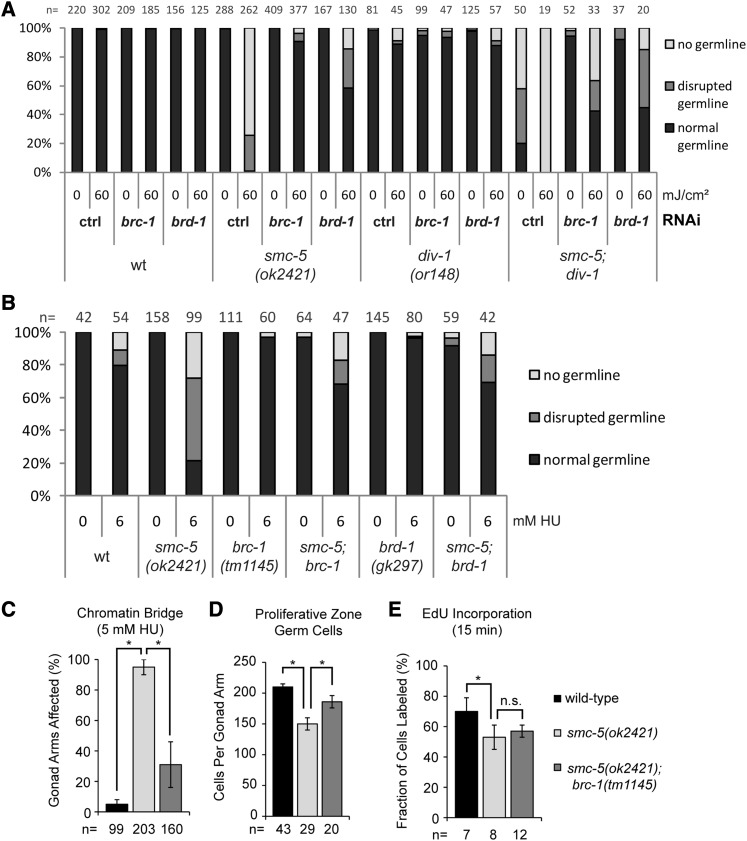
Figure 5.
Inactivation of the BRC-1/BRD-1 complex alleviates sensitivity of smc-5 mutants to DNA damage and replicative impairments. (A) Graph shows germline development quantification of worms 3 days after irradiation with UVB at L1 stage or untreated control worms. As read-out, worms were categorized into groups of “normal,” “disrupted,” and “no germline” by inspection on a dissection microscope. “n” indicates number of animals assessed. A representative experiment is shown. (B) Germline development quantification of worms raised on NGM plates containing indicated concentration of HU starting from L1 larval stage. Worms were categorized into groups of “normal,” “disrupted,” and “no germline” by inspection on a dissection microscope. “n” indicates number of worms inspected. A representative experiment is shown. (C) Fraction of gonad arms with chromatin bridges is averaged from three independent experiments with error bars indicating 95% confidence interval (C.I.) of the mean. The asterisk represents a P-value < 0.001 calculated by two-tailed Fisher’s exact test comparing the total chromatin-bridge positive and negative gonad arms combined from the three experiments. “n” represents total number of gonad arms examined. (D) Number of germ cells in the proliferative zone. The number of gonad arms analyzed (“n”) is indicated at the base of each column. P-values calculated by two-tailed Student’s t-test are indicated. Error bars indicate the 95% C.I. (E) Mean fraction of germ cells with EdU incorporation after 15 min of labeling is presented with error bars indicating 95% C.I. Number of germ lines examined (“n”) is indicated. The asterisk represents a P-value < 0.001 calculated by two-tailed Fisher’s exact test comparing the total number EdU-positive and -negative germ cells per genotype.

