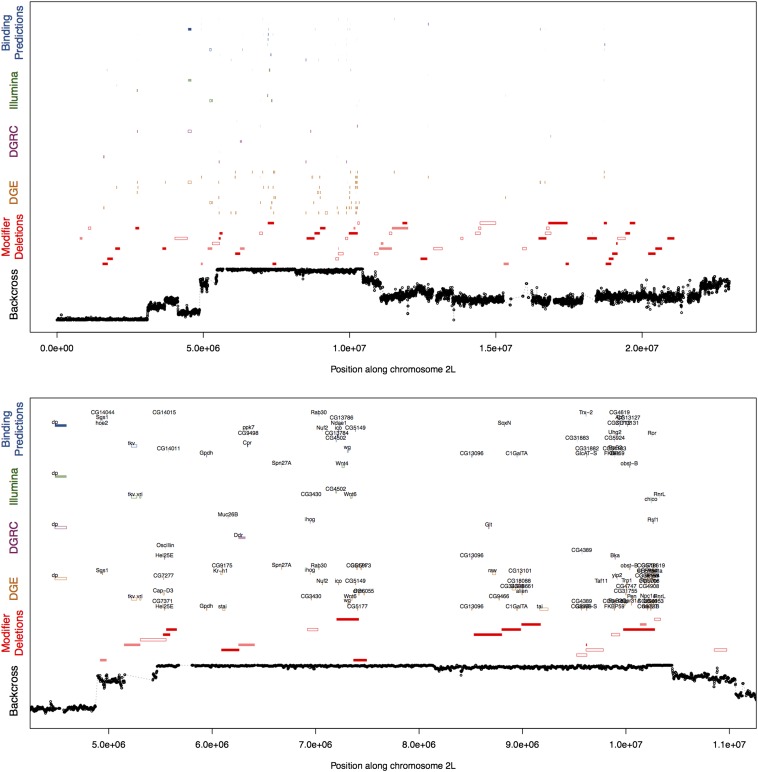
Figure 6.
Integration of multiple genomic datasets to generate a narrow set of candidate loci influencing background dependence of sdE3. Examples of integrated plots showing results of independent genomic datasets used to investigate the genetic basis of background dependence of the sdE3 phenotype. Backcross: Average frequency of the ORE (short wing) allele across four short-wing introgression lines. Modifier deletions: Open bars represent deletions with a significant main effect on the sdE3 phenotype; light shaded bars represent deletions with a significant background-dependent effect on the sdE3 phenotype; and dark shaded bars represent deletions in which both the main and interaction effects are significant. DGE: Open bars represent genes whose transcript counts are influenced by sd genotype; light shaded bars represent genes showing evidence of genotype-dependent allelic imbalance; and dark shaded bars represent genes showing evidence of both an overall effect of sd genotype and genotype-dependent allelic imbalance. DGRC and Illumina: Open bars represent genes showing evidence of an effect of sd genotype on expression; light shaded bars represent genes showing evidence of a genotype-by-background interaction effect; and dark shaded bars represent genes showing evidence of both the main and interaction effects. Binding predictions: Open bars represent genes predicted to be overall SD binding targets (in at least one of the two genetic backgrounds); light shaded bars represent genes predicted to show differential affinity for SD between the two backgrounds; and dark shaded bars represent genes showing evidence of both overall SD binding and differential affinity between backgrounds. Only genes showing evidence of at least four significant effects across all datasets are shown.

