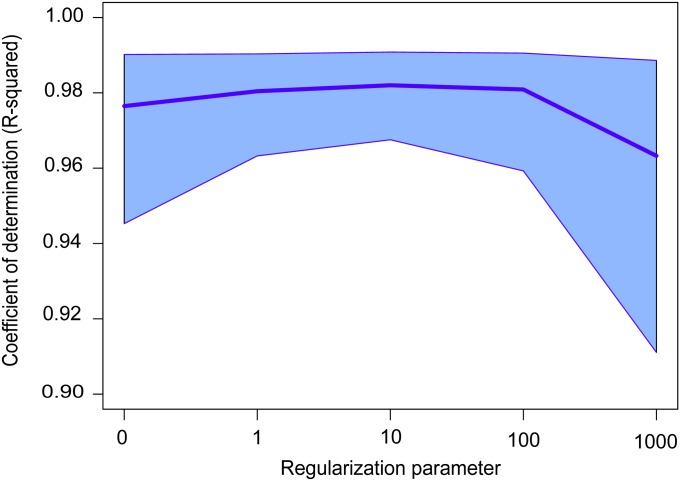
Figure 1.
Correlation between sNMF and ADMIXTURE estimates. Shown is squared correlation (coefficient of determination, R2) between the ancestry coefficients estimated by each program. For each number of clusters (K), the result corresponds to the maximum correlation over five runs, averaged over values of the regularization parameter <1000 and over six HGDP data sets. The shaded area corresponds to a 95% confidence interval displayed for each value of the regularization parameter, α.

