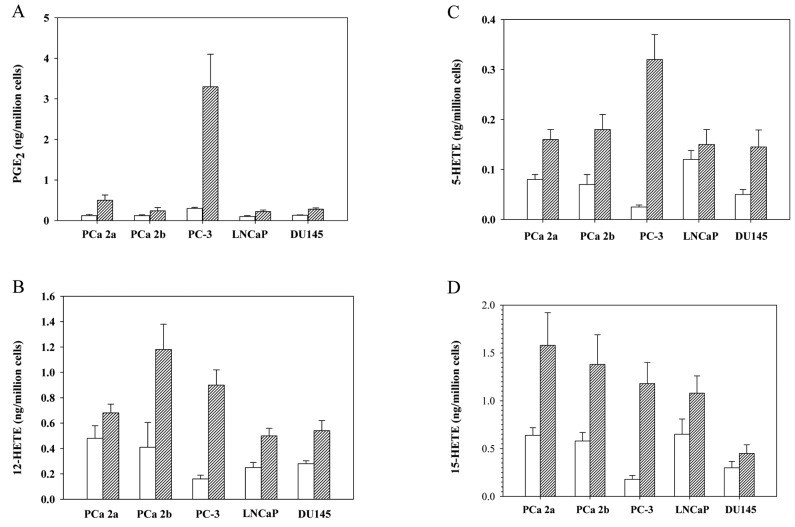
Figure 3.
Endogenous (clear bars) and exogenous (striped bars) eicosanoid metabolism in the five human prostate cancer cell lines. For the endogenous eicosanoid analysis, cells (3×10⁶) were plated and allowed to attach overnight. They were then harvested by trypsinization and subjected to eicosanoid analysis using LC/MS/MS, as described in Materials and methods. For the exogenous eicosanoid analysis, cells (5×10⁶) were treated with 50 μM arachidonic acid for 10 min and then analyzed for eicosanoid content. Data are presented as the means ± SDs of three separate experiments.

