
Figure 4.
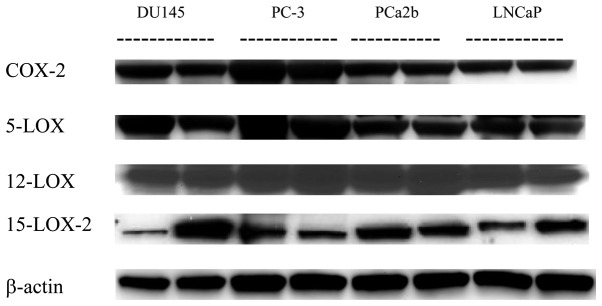

Expression of the eicosanoid enzymes (top panel) and their relevant products in human prostate mouse xenograft tissues (bottom panel). Tumor tissues were collected when the tumor volume was approximately 1 cm3. Protein levels were detected by Western blotting with relevant antibodies (top panel). Flash-frozen tissues were pulverized and extracted for the endogenous eicosanoid levels by LC/MS/MS. The levels of eicosanoids were normalized by protein concentrations (bottom panel, A–D). Data are presented as the means ± SDs in each group (n≥5). *p<0.05, **p<0.01 vs. LNCaP xenograft tissues. ***p<0.001 vs LNCaP, DU145 and PCa 2b xenograft tissues.