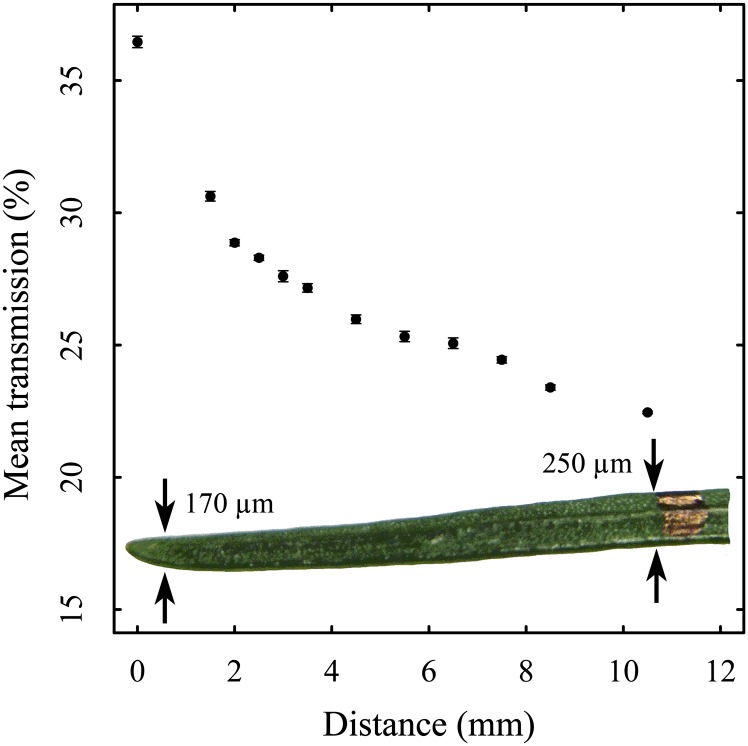
Figure 1.
Transmission profile of a silver fir needle along the main axis, with the thickness of the needle at the outermost points of the profile. Each point represents the mean over five measurements. The sd is given for every point but sometimes is smaller than the pixel of the point (Supplemental Table S1). [See online article for color version of this figure.]

