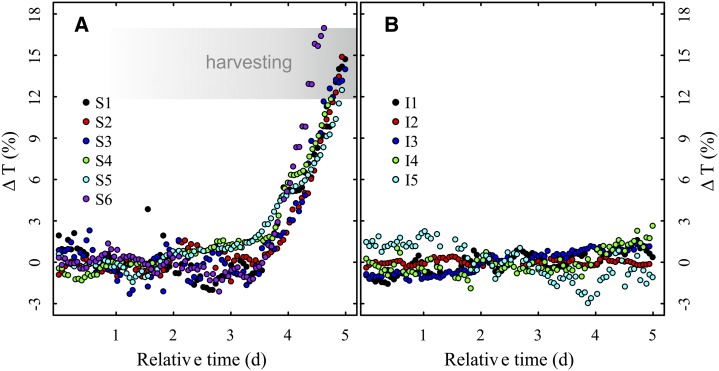
Figure 4.
ΔT over a relative time for the six water-stressed seedlings S1 to S6 (A) and the five irrigated control seedlings I1 to I5 (B). The transmission curves of the stressed seedlings were aligned at their respective baselines, and the range of ΔT at harvesting is shown. While the stressed seedlings show a relatively uniform increase in transmission and therefore a decrease in water content, the irrigated seedlings remain at a relatively constant level of transmission and therefore show no signs of dehydration. [See online article for color version of this figure.]

