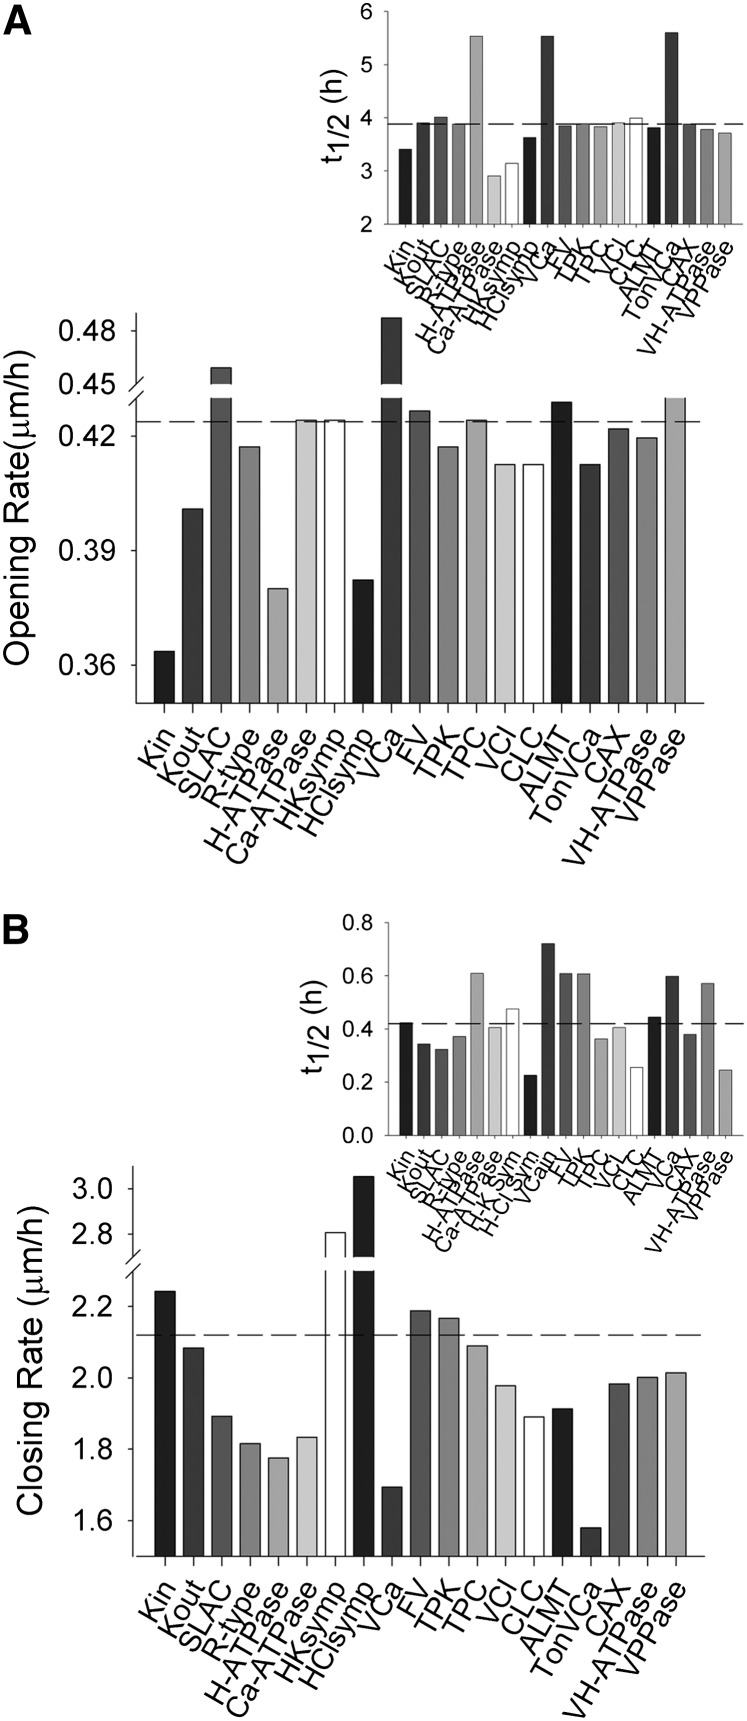
Figure 3.
Selectively reducing transporter populations by 50% in simulations yields a subset of transport activities that affect the initial kinetics and the halftimes for response, but invariably affect both stomatal opening and closing. Transporter types are described in the legend to Figure 1. A, Initial rates of stomatal opening for elevation of each transporter population. The inset shows halftimes for opening. Horizontal lines in each case indicate the opening rate and halftime for the control simulation. B, Initial rates of stomatal closing for elevation of each transporter population. The inset shows halftimes for closing. Horizontal lines in each case indicate the closing rate and halftime for the control simulation.

