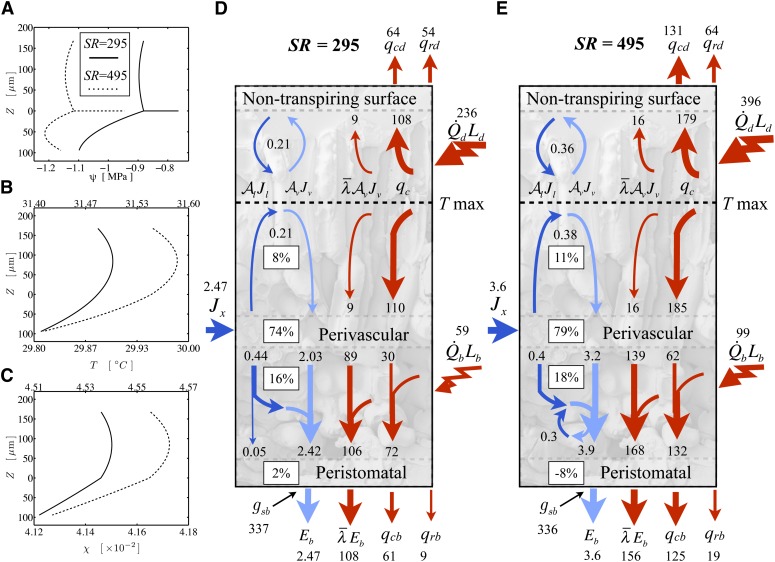
Figure 4.
The shift at higher short-wave radiation loads to a condensing state at the lower epidermis in an oak-like leaf with an air fraction of 0.434. For A to C, solid lines are for the low load (SR = 295 W m−2) and dotted lines are for the high load (SR = 495), with the scale on the top x axis in B and C. A, Water potential profile through the leaf thickness (upper = adaxial, lower = abaxial) with the vascular plane at z = 0. The horizontal line is the potential drop between the stem and the vascular plane. B, Temperature profile. C, Mole fraction profile. D and E, Fluxes of energy (red; W m−2) and molecules (dark blue for liquid and light blue for vapor; mmol m−2 s−1) and the percentage of the total transpirational phase change occurring in different regions of a leaf under a low short-wave load (SR = 295; D) and a high load (SR = 495; E). The high load pushes the internal face of the lower epidermis into a condensing state (the internal evaporative flux exceeds transpiration), such that there is a small liquid flux back into the spongy mesophyll, where it reevaporates.

