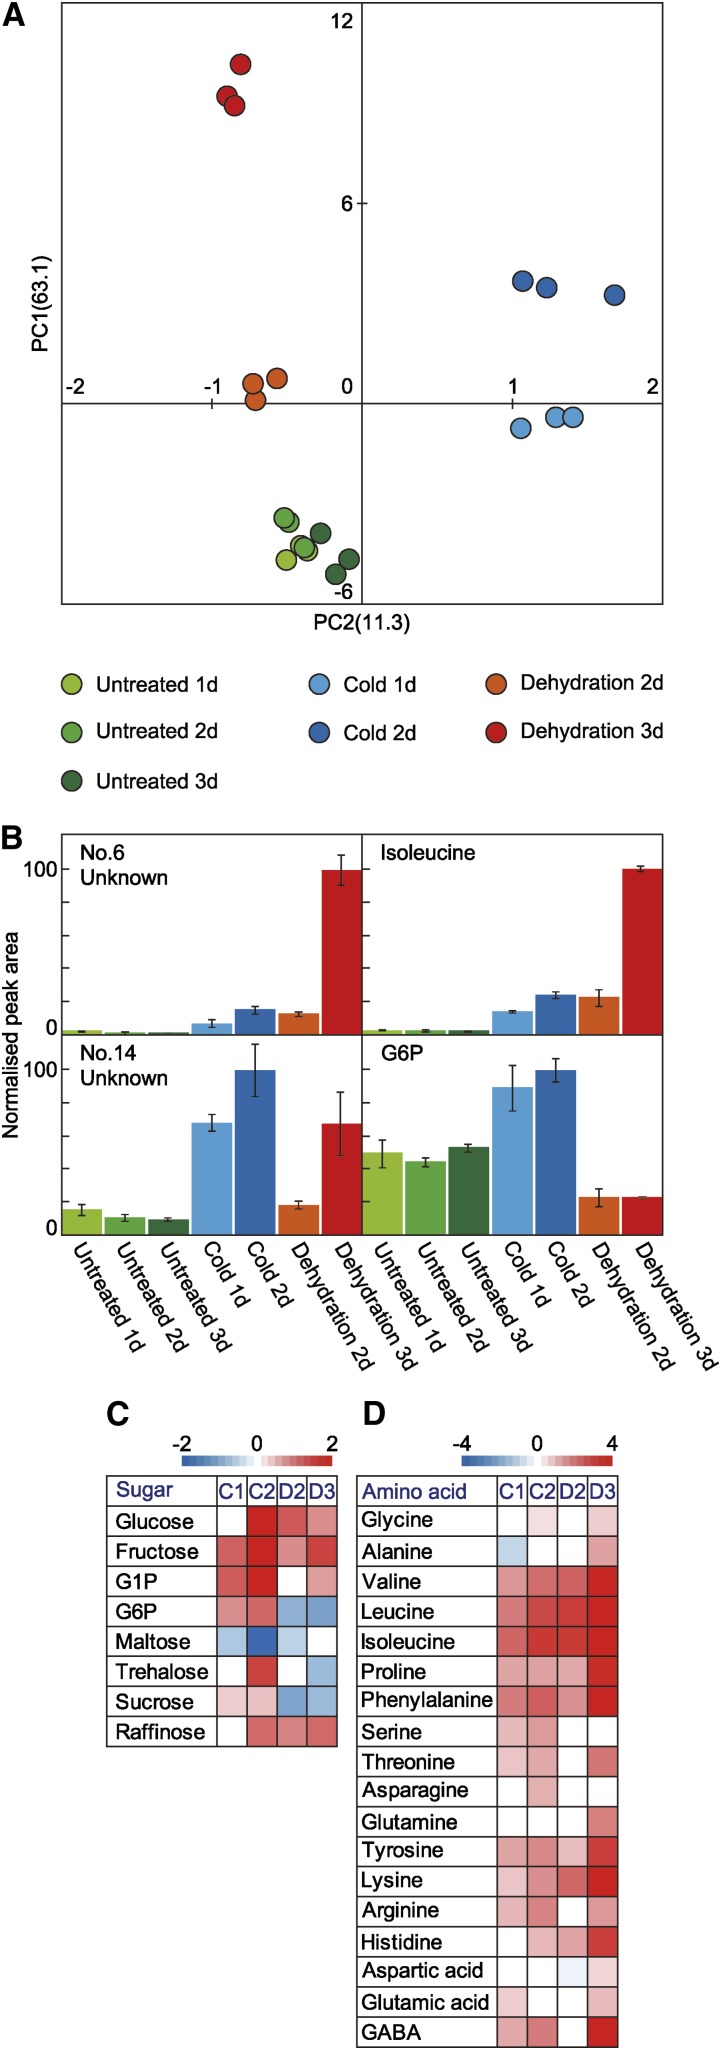
Figure 1.
Statistical analysis of 152 metabolites profiled in untreated rice plants and rice plants subjected to cold or dehydration treatments. Levels of 152 metabolites were measured in rice plants subjected to seven treatments: cold (10°C) for 1 d (Cold 1d) or 2 d (Cold 2d); dehydration (water withheld) for 2 d (Dehydration 2d) or 3 d (Dehydration 3d); and untreated for 1, 2, or 3 d (Untreated 1d, 2d, and 3d, respectively). A, PCA for metabolites. Values for y and x axes are values for PC1 and PC2, respectively. B, Representative metabolites showing the highest and second highest eigenvector values. In each case, maximum level of metabolite was set to 100. Values are means (n = 3 experiments); error bars show sd. C and D, Relative levels of representative sugars (C) and amino acids after cold or dehydration treatments. C1, Cold 1d; C2, cold 2d; D2, dehydration 2d; D3, dehydration, 3d; GABA, γ-aminobutyric acid; G1P, glucose 1-phosphate.

