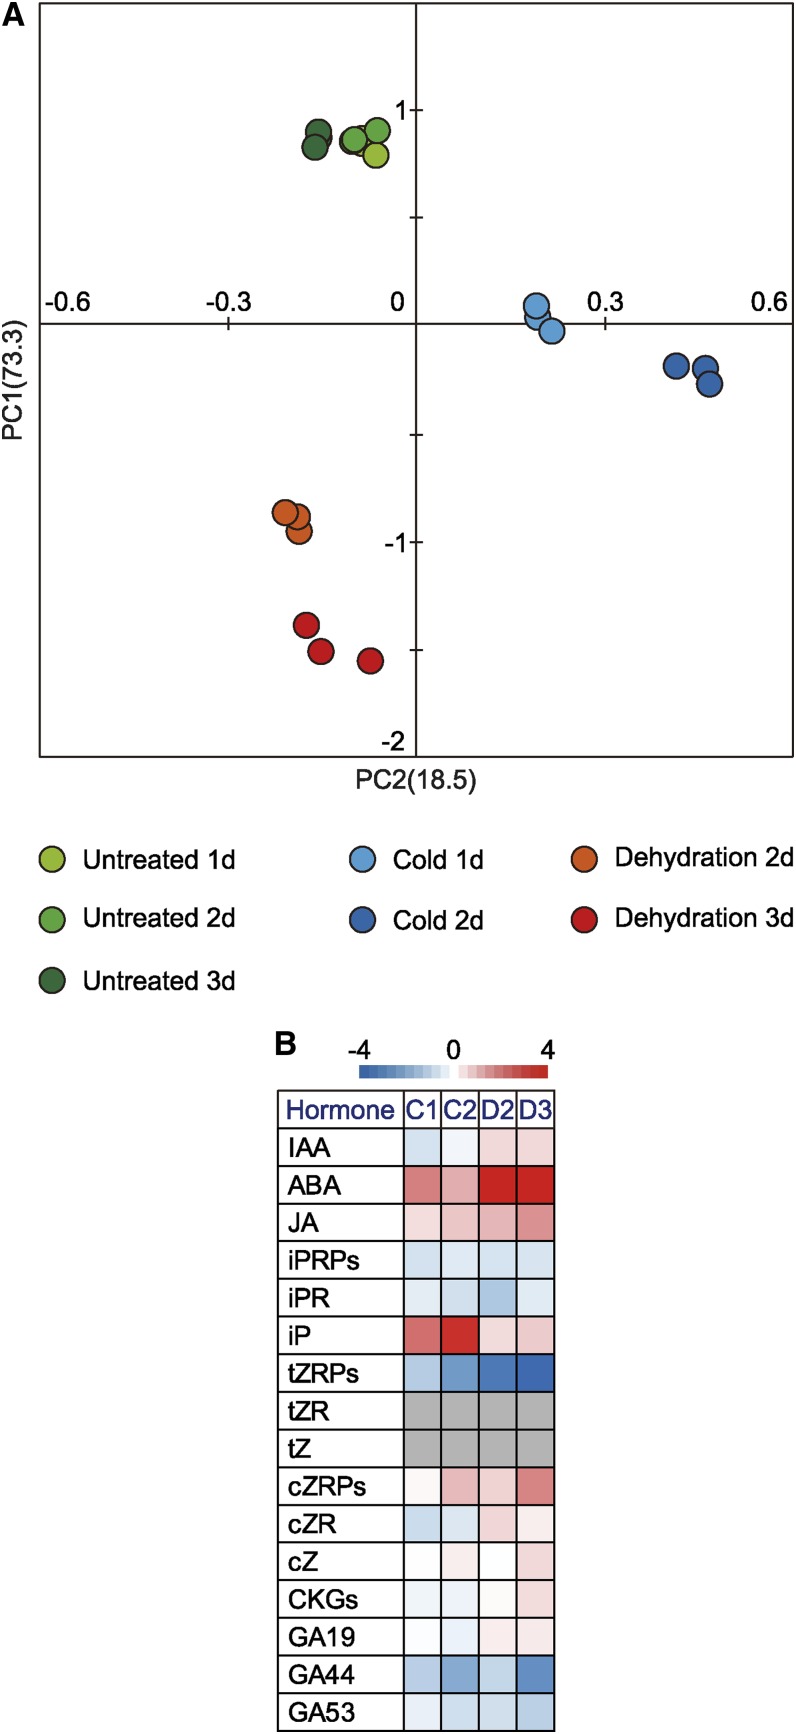
Figure 2.
Statistical analysis of changes in profiles of rice phytohormone levels after exposure to cold or dehydration. A, PCA for phytohormones. Values for y and x axes are values for PC1 and PC2, respectively. B, Relative levels of representative phytohormones after cold or dehydration stress. A small gray square indicates that the phytohormone could not be detected. CKGs, Cytokinin glucosides; cZ, cis-zeatin; cZR, cis-zeatin riboside, cZRPs, cis-zeatin 5′-Ps; GA19, gibberellin A19; GA44, gibberellin A44; GA53, gibberellin A53; IAA, indoleacetic acid; iPR, isopentenyladenosine; iPRPs, N6-(Δ2-isopentenyl) adenine ribotides; JA, jasmonic acid; tZR, trans-zeatin riboside.

