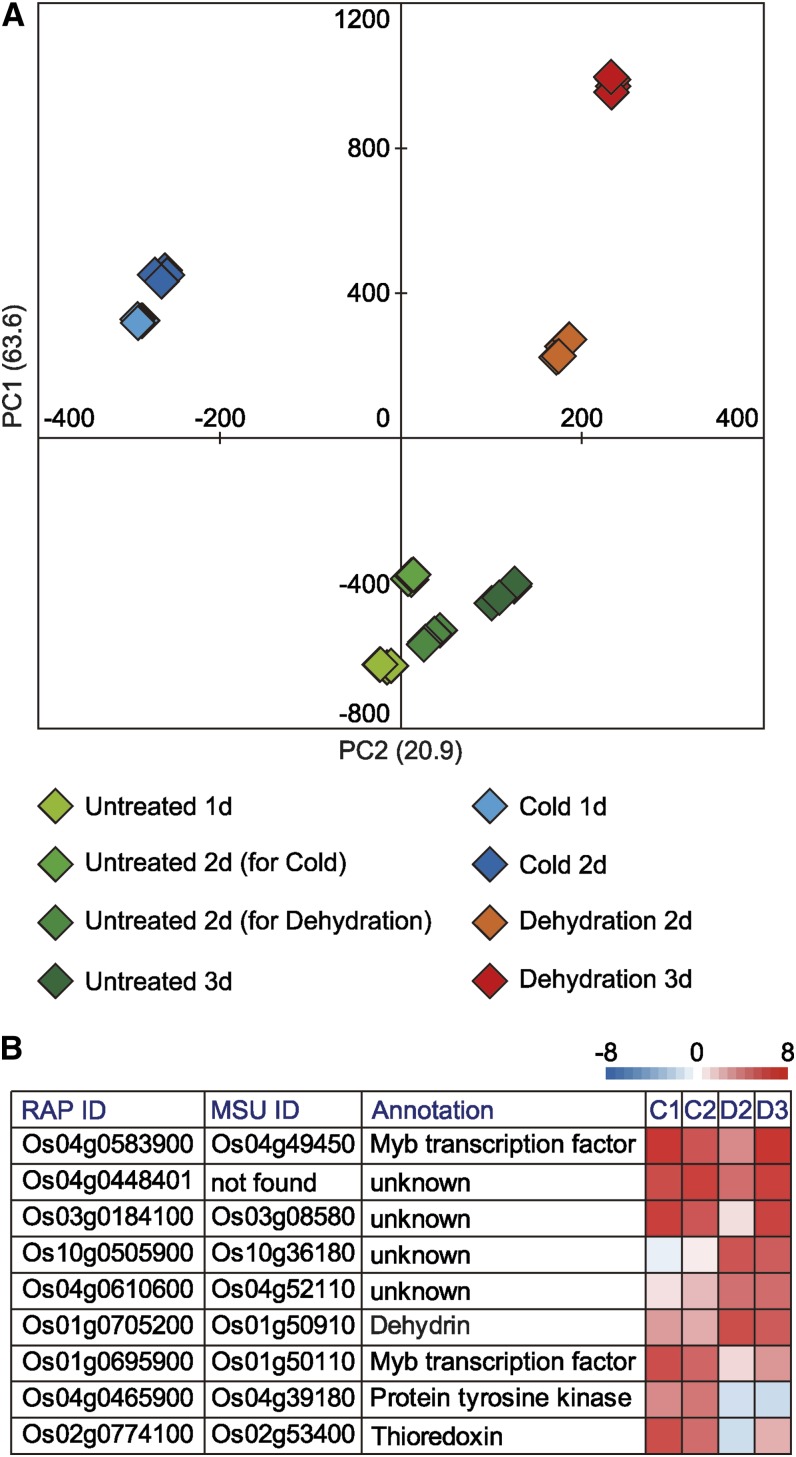
Figure 3.
Statistical analysis of changes in the profiles of rice transcript levels after exposure to cold or dehydration. A, PCA for transcript data obtained from oligonucleotide microarrays. Values for y and x axes are values for PC1 and PC2, respectively. B, Representative cold- and dehydration-responsive genes identified using oligonucleotide microarrays. Genes shown are those genes with the first, second, and third highest eigenvector values. Heat maps illustrate transcript levels of representative cold- and dehydration-responsive genes. MSU, Michigan State University; RAP, The Rice Annotation Project.

