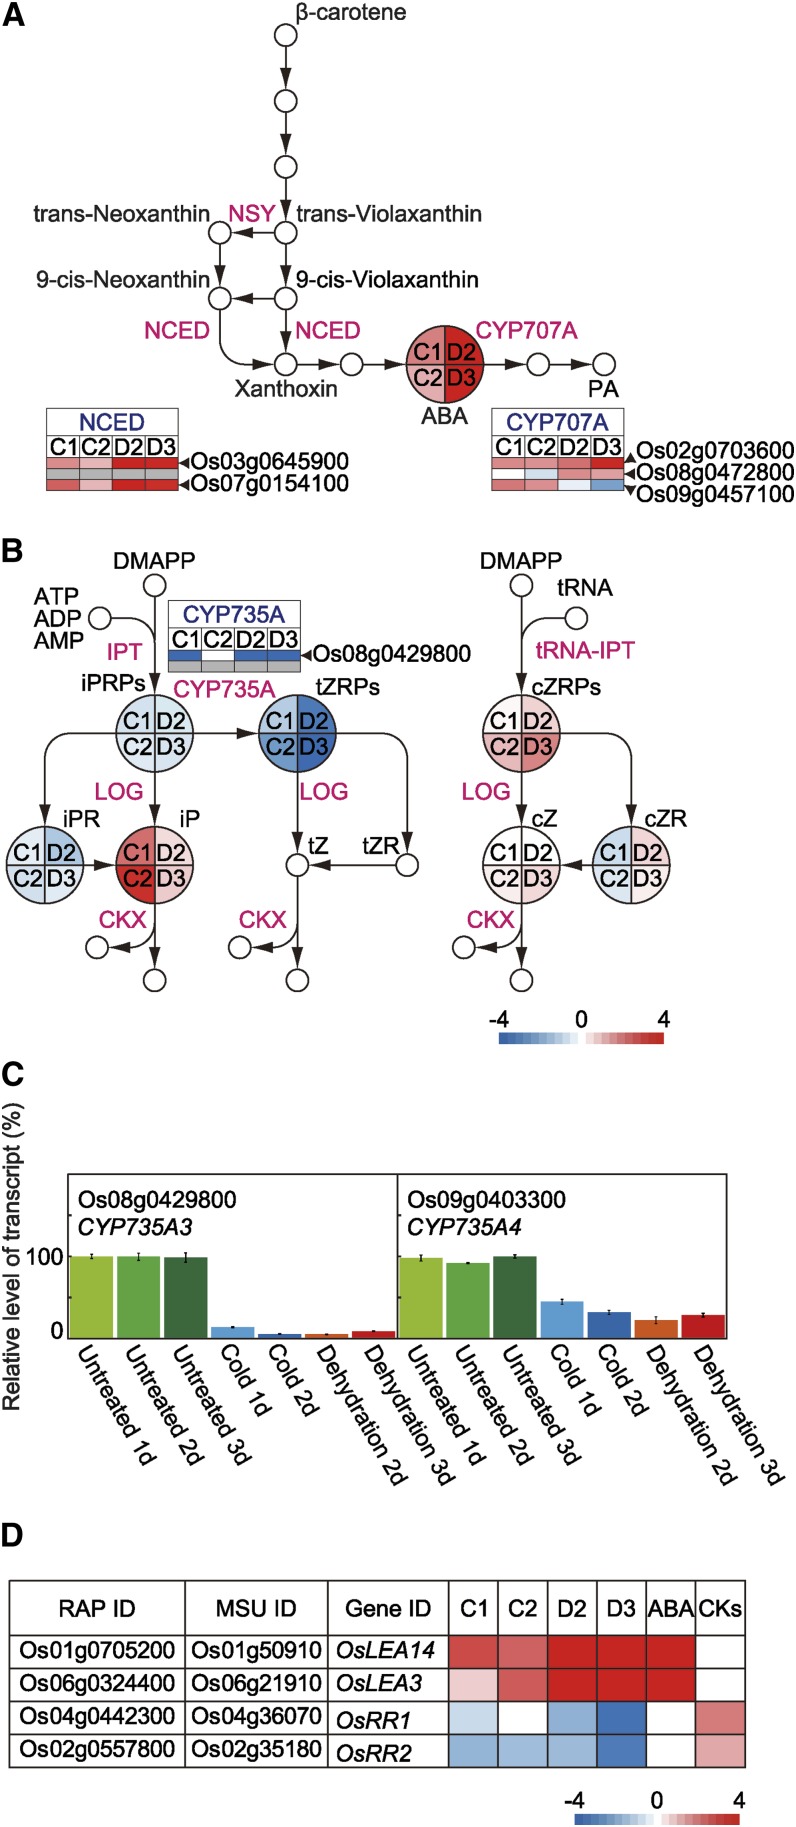
Figure 6.
Pathways for ABA and CK biosyntheses. A, ABA biosynthesis. B, CK biosynthesis. C, Levels of transcripts for genes encoding CYP735As determined by qRT-PCR. D, Expression of genes encoding LEAs and OsRRs. Heat maps illustrate transcript levels of representative cold- and dehydration-responsive genes. A small gray square denotes the absence of a probe for that gene in oligonucleotide microarray. We referred to http://ricexpro.dna.affrc.go.jp/ for expression of LEA and OsRR in ABA- or CK-treated rice plants. Heat maps illustrate accumulated levels of representative cold-responsive and dehydration-responsive phytohormones. CKX, Cytokinin oxidase/dehydrogenase; DMAPP, dimethylallyl diphosphate; IPT, adenosine P-isopentenyltransferase; LOG, lonely guy, cytokinin NMP phosphoribohydrolase; NSY, neoxanthin synthase; tRNA-IPT, tRNA isopentenyltransferase.

