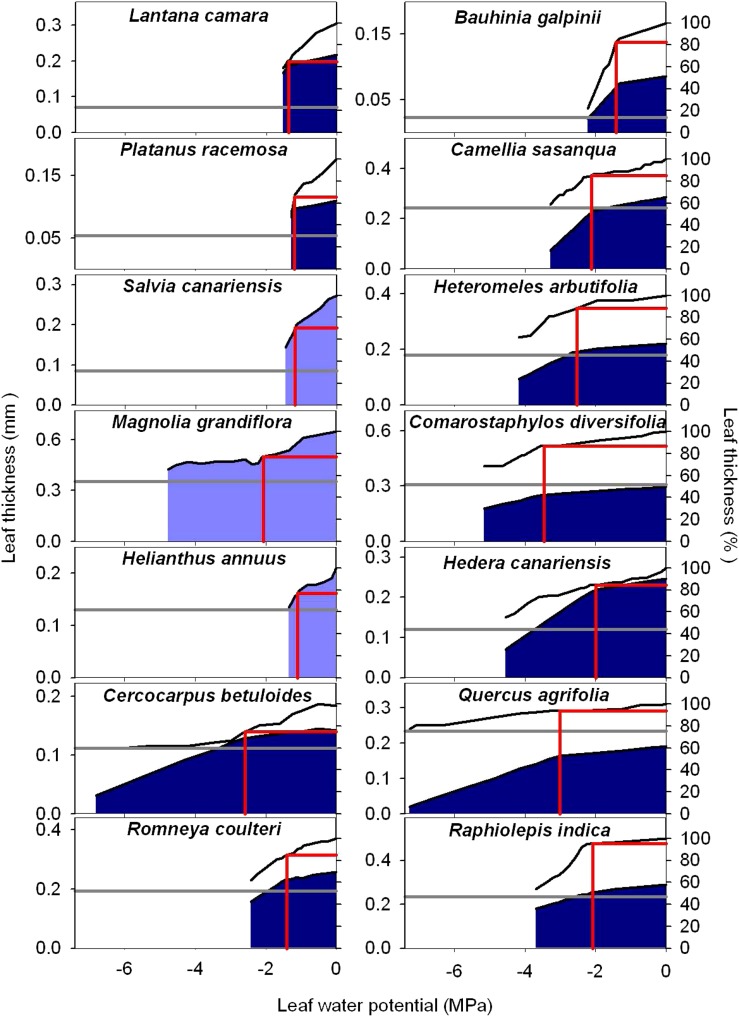
Figure 3.
Plots of leaf thickness shrinkage versus Ψleaf for 14 species of diverse leaf form and texture and drought tolerance; a typical plot is presented for each species. The blue shaded areas represent the thickness of the cells, and the white areas represent the thickness of the intercellular airspace. The gray horizontal lines represent the maximum shrinkage in leaf thickness (i.e. for an oven-dried leaf). The red vertical lines represent TLP, and the red horizontal lines represent the thickness of the leaf at TLP. Species are ordered top left to bottom right from lowest to highest ε. Due to area wrinkling with dehydration of sunflower, M. grandiflora, and S. canariensis, the cell and airspace thickness could not be estimated, and only the whole-leaf shrinkage is shown in light blue (see “Materials and Methods”). [See online article for color version of this figure.]

