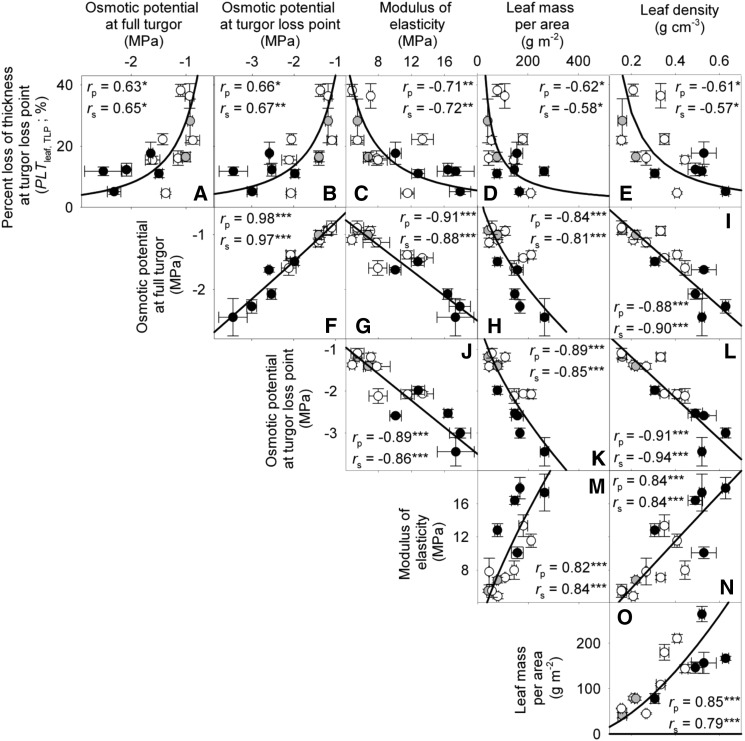
Figure 5.
Relationship of loss of leaf thickness at TLP with pressure-volume curve parameters and leaf structural traits for 14 species of diverse leaf form and texture and drought tolerance. A to E show traits plotted against the percentage loss of leaf thickness at TLP: leaf osmotic potential at full turgor (A), leaf osmotic potential at TLP (B), ε (C), LMA (D), and leaf density (E). F to O show the intercorrelation of those five traits. Species native to moist habitats are represented in white, woody species from dry habitats are represented in black, and herbs from dry habitats are represented in gray. Fitted standardized major axes are as follows:  for A,
  for B,
  for C,
  for D,
  for E,
  for F,
  for G,
  for H,
  for I,
  for J,
  for K,
  for L,
  for M,
  for N, and
  for O. *P < 0.05, **P < 0.01, ***P < 0.001.

