Table I. Results from model simulations testing the impacts on leaf hydraulic vulnerability of declines in conductivity in the xylem and outside-xylem pathways.
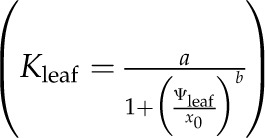
For each set of simulations, we present Rox, xylem P50 and outside-xylem P50, Kmax, Ψleaf at leaf P50 and leaf P80, Pxylem at leaf P50, and the initial slope of the leaf hydraulic vulnerability curve (at −0.1 MPa), obtained from the logistic function  , which was selected as the maximum likelihood model in all simulations (compare with Supplemental Table S1).
| Input Conditions |
Output of Leaf-Level Responses |
||||||||
|---|---|---|---|---|---|---|---|---|---|
| Scenario | Simulations | Rox | Xylem P50 | Outside-Xylem P50 | Kmax | Leaf P50 | Leaf P80 | Pxylem at P50 | Initial Slope |
| % | MPa | mmol m−2 s−1 MPa−1 | MPa | mmol m−2 s−1 MPa−2 | |||||
| Rox > Rx | Low vulnerability for xylem and outside-xylem components | 74 | −1.00 | −1.00 | 8.62 | −5.50 | −11.6 | −0.74 | −0.09 |
| High vulnerability for only the outside-xylem component | 76 | −1.00 | −0.25 | 7.56 | −2.37 | −7.78 | −0.28 | −2.08 | |
| High vulnerability for only the xylem component | 71 | −0.25 | −1.00 | 8.18 | −1.53 | −2.72 | −0.32 | −0.28 | |
| High vulnerability for xylem and outside-xylem components | 74 | −0.25 | −0.25 | 7.26 | −1.48 | −3.83 | −0.25 | −1.97 | |
| Rx > Rox | Low vulnerability for xylem and outside-xylem components | 39 | −1.00 | −1.00 | 9.03 | −2.49 | −5.03 | −0.78 | −0.32 |
| High vulnerability for only the outside-xylem component | 42 | −1.00 | −0.25 | 8.32 | −1.23 | −3.92 | −0.35 | −4.50 | |
| High vulnerability for only the xylem component | 36 | −0.25 | −1.00 | 8.02 | −0.83 | −1.78 | −0.39 | −3.06 | |
| High vulnerability for xylem and outside-xylem components | 39 | −0.25 | −0.25 | 7.65 | −0.68 | −1.75 | −0.30 | −6.02 | |
