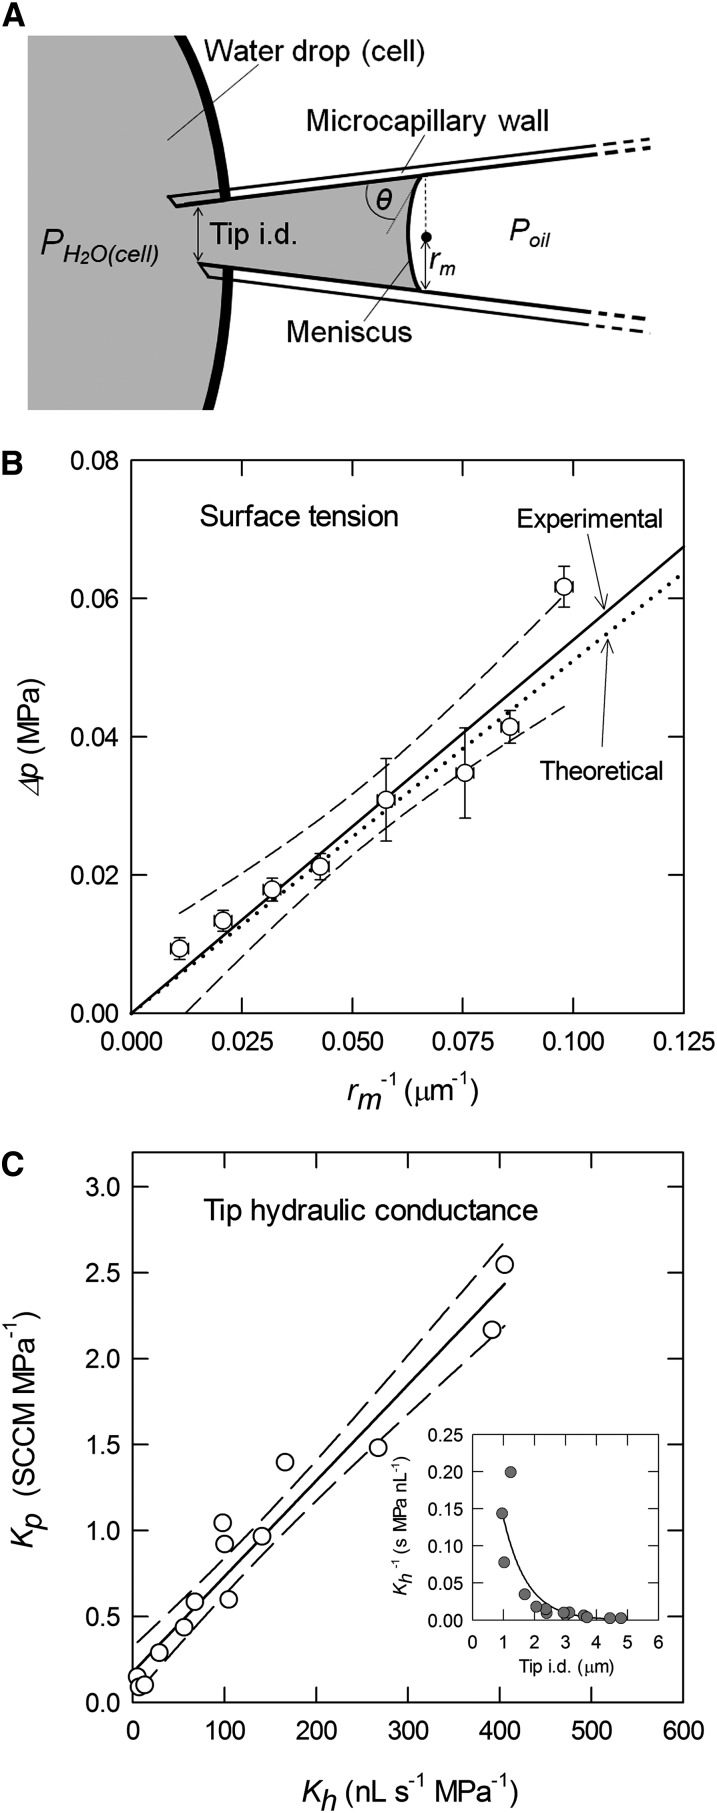
Figure 2.
A, Schematic presentation of a microcapillary tip at equilibrium in a water drop or cell (for abbreviations, see “Materials and Methods”). B, Δp (= Poil – PH2O) as a function of rm−1 for a tip in a water drop (PH2O = 0) at equilibrium. The linear regression line obtained from measured values of rm−1 (x) and Δp (y) was y = 0.0524x + 0.0001 (r2 = 0.92), resulting in an experimentally determined value of slope (a) of 52.4 mN m−1. Dashed lines indicate the 95% confidence intervals as calculated from Student’s percentage t distribution as obtained from 36 to 115 frames. The dotted line indicates a theoretical value based on θ = 50.4° (observed) and t = 40.0 mN m−1 for dimethyl silicone oil, similar in composition to the silicone oil used. C, Linear relation between Kp and Kh. SCCM refers to standard cubic centimeters per minute indicating cm3 min−1 at 0°C at 1 atmosphere. The linear regression line between Kh (x) and Kp (y) was y = 0.0056x + 0.1753 (r2 = 0.95). The inset shows the relationship between tip resistance (y; Kh−1) and tip i.d. (x) of y = 0.507exp−1.308*x (r2 = 0.72).

