Figure 3.
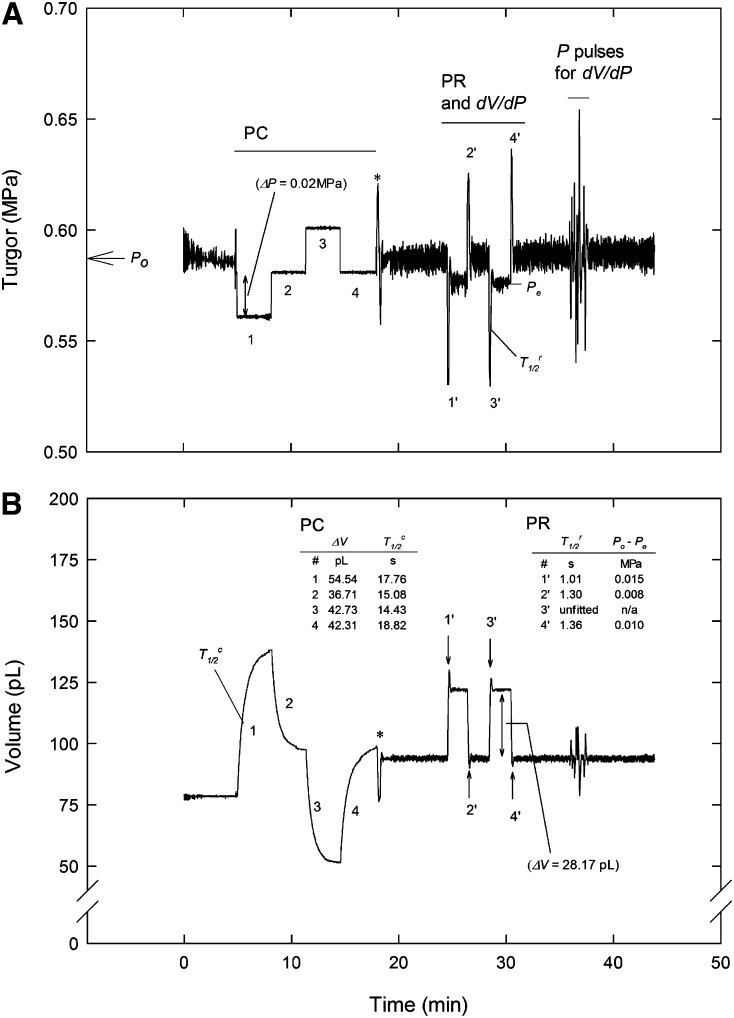
Example ACPP recording showing turgor (Pcell; A) and V (B) of cell fluid in the capillary for repeated PC and PR experiments on the same T. virginiana epidermal cell. Also shown are the water relations parameters calculated from each experiment. Following the PR experiments, a series of P pulses were manually applied in order to expand the range for measurement of dV/dP for this cell. Asterisks indicate the manual switch between PC and PR modes.

