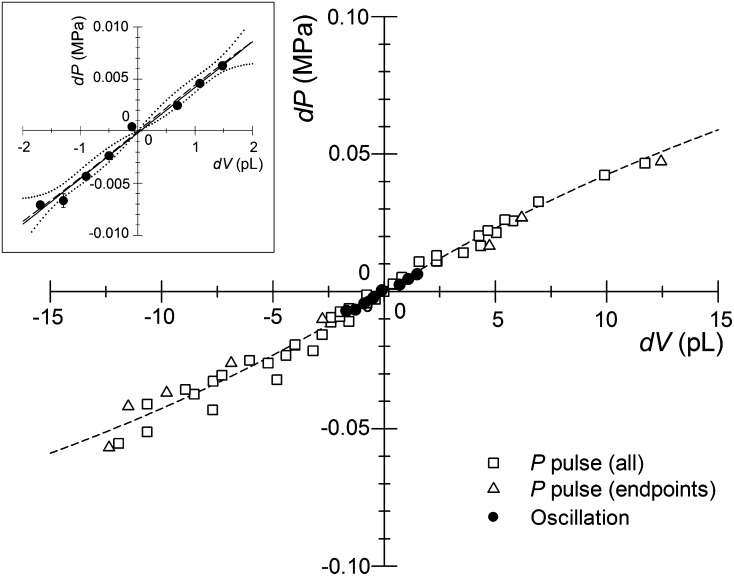
Figure 4.
Relationship between dV and dP for the cell shown in Figure 3, either during the period of P pulses (white symbols) or during periods when P and V were stable but oscillating due to feedback control (black circles). The dV and dP relationship is typically obtained from conventional P pulses using only the end-point values for each pulse (white triangles), but this relation is consistent with all the P pulse data (all white symbols) and consistent with the sigmoidal relation (dashed line) expected from theory (see text). The inset shows the dV/dP relation from control oscillations around the meniscus set point at each equilibrium Pcell (Fig. 3). Each data point is the mean ± 95% confidence interval of n = 6 to 504 frames collected at each meniscus location as calculated from Student’s percentage t distribution (most error bars are hidden by the symbol). In the inset, the long dash line is the sigmoidal relation fit to the mean oscillation points, with the short dash lines indicating the 95% confidence interval for this relation. The solid line within this confidence interval is a simple linear regression (y = 0.0044x − 0.0002 [r2 = 0.99]) fit to all oscillation data points.

