Figure 1.
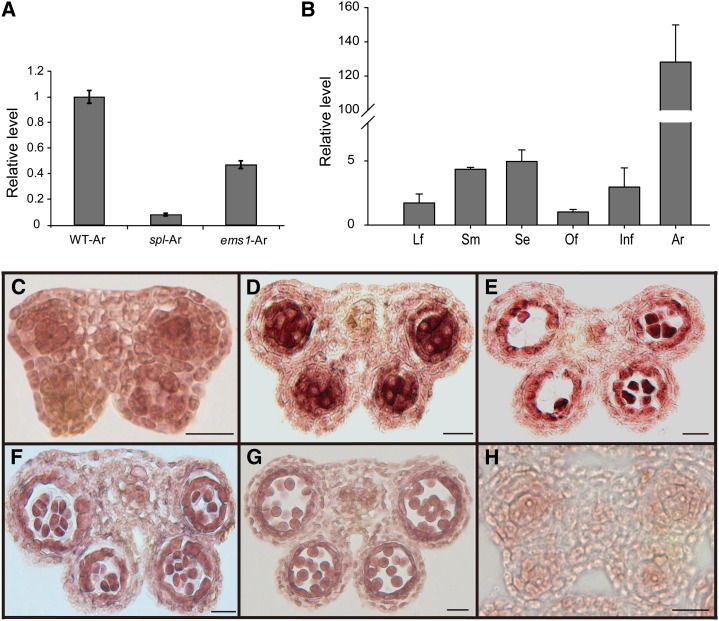
The CDM1 expression pattern. A, Analysis of CDM1 expression in wild-type, spl, and ems1 anthers using qRT-PCR. B, Detection of CDM1 expression in various tissues using qRT-PCR. C–G, In situ hybridization of the CDM1 transcript with a CDM1 antisense probe in the wild type. Anthers at stages 4 (C), 5 (D), 6 (E), and 7 (F). CDM1 expression was greatly reduced (G). H, In situ hybridization of the CDM1 transcript with a CDM1 sense probe in a wild-type stage 5 anther. Only the background signal was detected. Ar, Anther; ems1-Ar, ems1 anther; Infl, young inflorescence; Lf, leaf; Of, open flower; Se, silique; Sm, stem; spl-Ar, spl anther. Bar = 20 μm in C–H.

