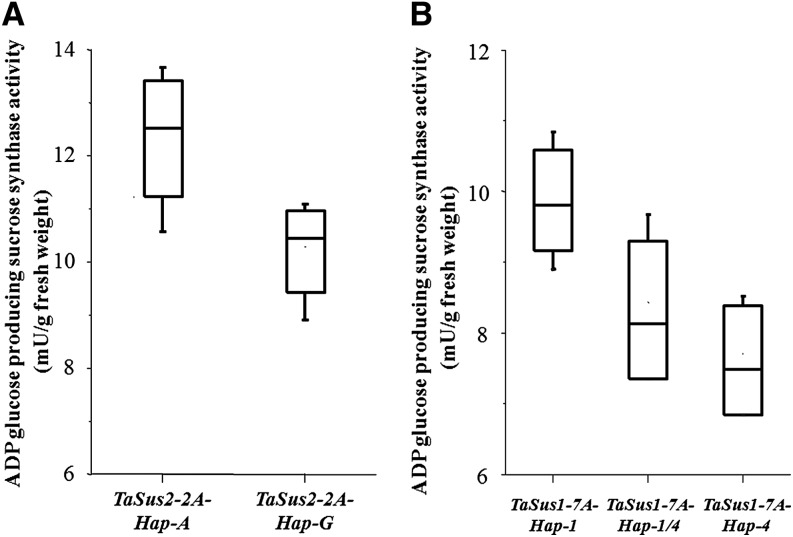
Figure 7.
Boxplots of enzyme activities of Suc synthase in developing seeds among different haplotypes at 15 DPA. The bottom and top of the box are the first and third quartiles, and the band inside the box is the second quartile. The ends of the whiskers represent the minimum and maximum of all the data. The materials used in A and B were the same sets of those in Figure 6, A and B, respectively. The Suc synthase activity was measured in ADP Glc synthetic direction.

