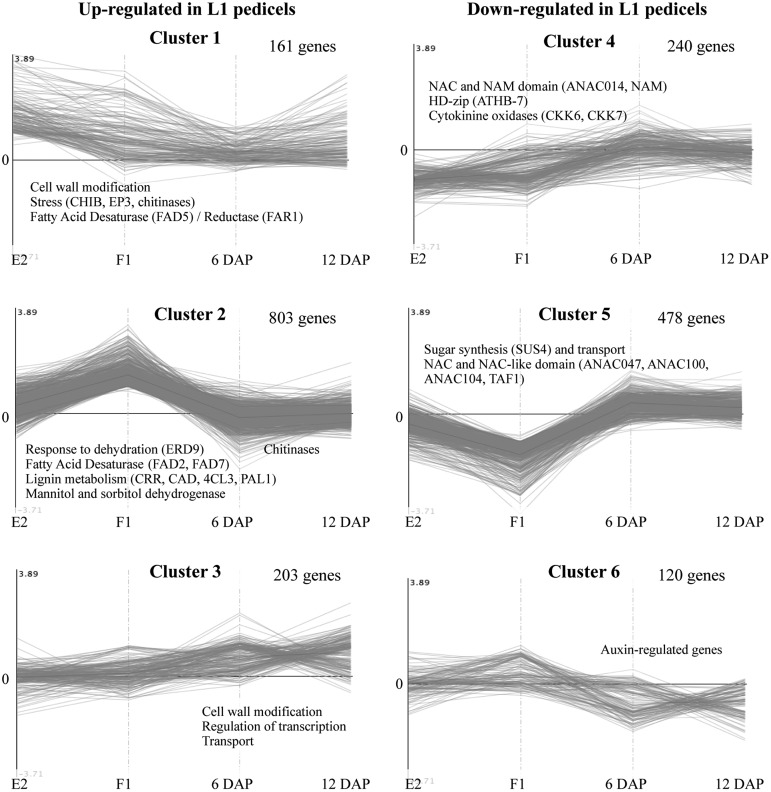
Figure 5.
K-means clustering of significantly differentially expressed genes between central and L1 pedicels at four developmental stages (E2, F1, 6 DAP, and 12 DAP). The left column represents clusters of genes up-regulated in L1 at one or more developmental stages. The right column represents clusters of genes down-regulated in L1 at one or more developmental stages. The number of genes in each cluster is shown next to the cluster number. Names of selected genes or gene families are indicated in each cluster.

