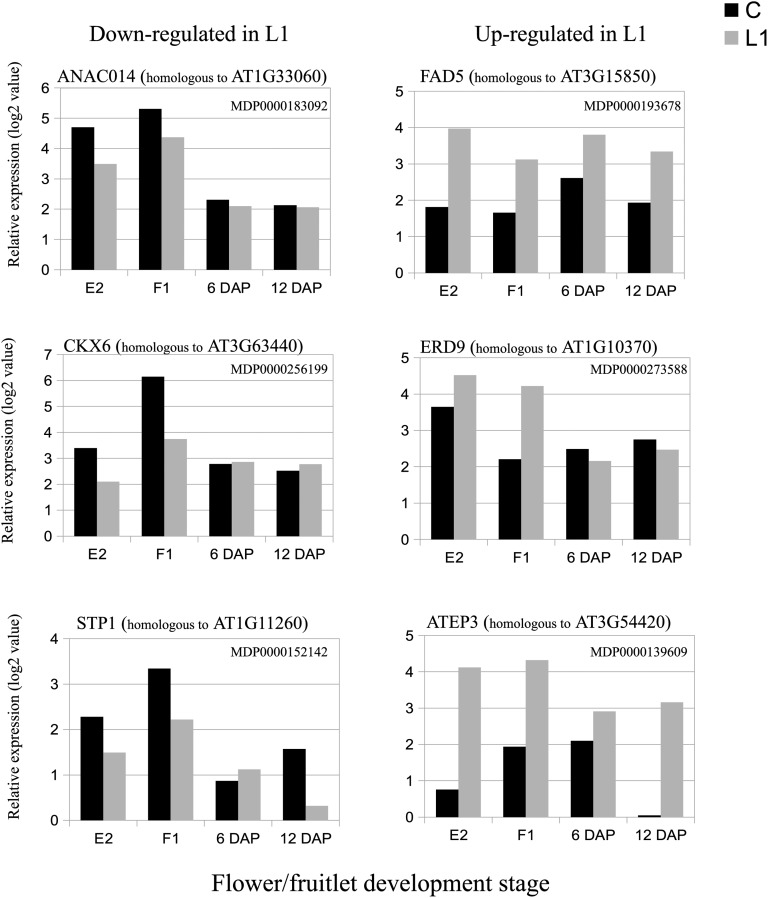
Figure 8.
Kinetics of the expression values of genes differentially expressed between central (C) and L1 X3177 apple pedicels as determined by microarray analysis at four developmental stages (E2, F1, 6 DAP, and 12 DAP). The left column shows expression values (log values) of genes significantly down-regulated in L1 compared with central pedicel sections. The right column shows expression values (log values) of genes significantly up-regulated in L1 compared with central pedicel sections. The array data were normalized with the lowess method. Normalized intensities (i.e. expression levels) were then subtracted from the background.

