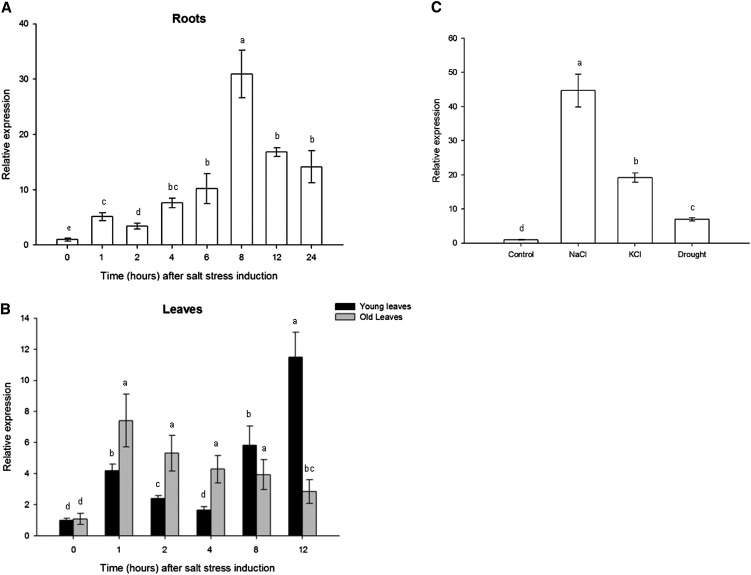
Figure 4.
A and B, qRT-PCR analysis of SlZF2 expression pattern in response to salinity (150 mm NaCl) in roots (A) or leaves (B; young and old leaves for 50-d-old plants). C, Expression of SlZF2 in roots of young tomato plants (3 weeks old) submitted to 150 mm NaCl, 150 mm KCl, or drought. Actin and GAPDH were used as internal controls. Data represent means and sd of three replicates. Letters indicate values of SlZF2 expression that differ significantly between treatments according to the Student-Newman-Keuls test at P < 0.05.

