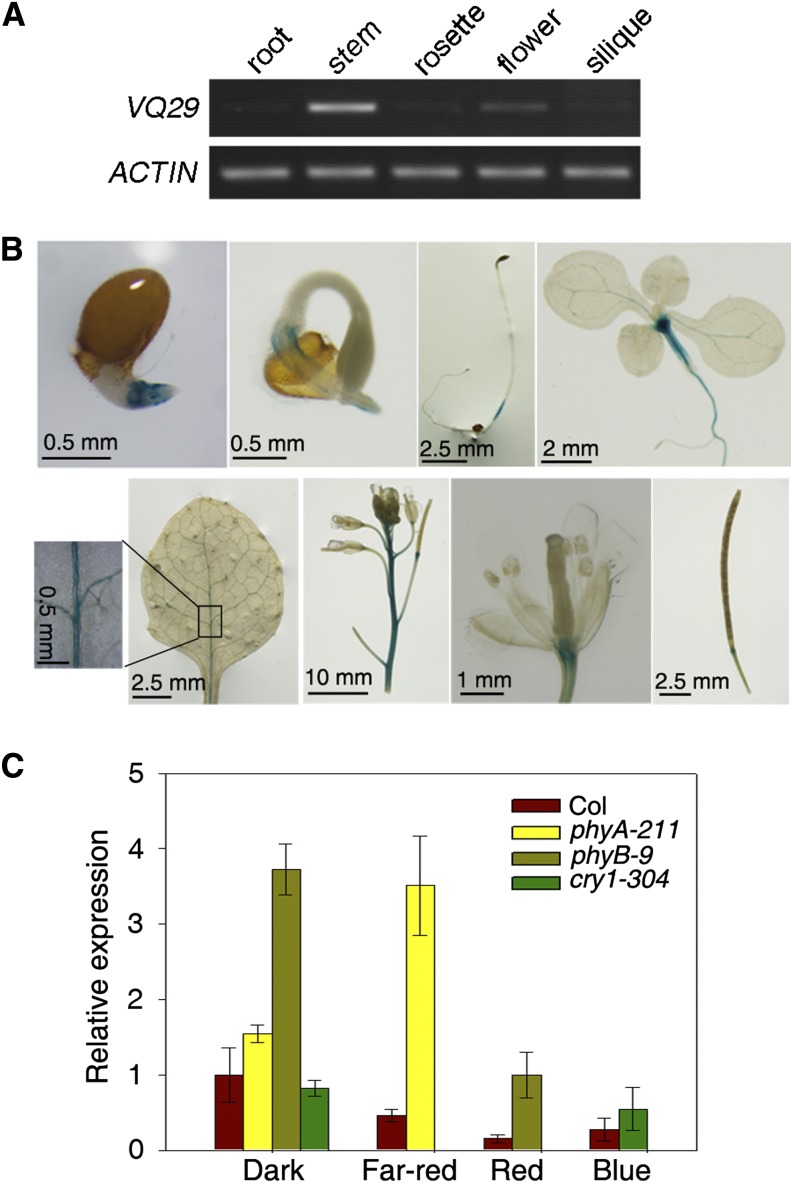
Figure 4.
Expression pattern of VQ29. A, RT-PCR of VQ29 in various tissues. Amplified actin served as a loading control. B, GUS staining in various tissues of ProVQ29:GUS transgenic plants. C, Quantitative RT-PCR analysis of VQ29 in the photoreceptor mutants under various light conditions and darkness. Seedlings were grown in the indicated conditions for 5 d. Error bars indicate the sd of three biological triplicates.

