Figure 7.
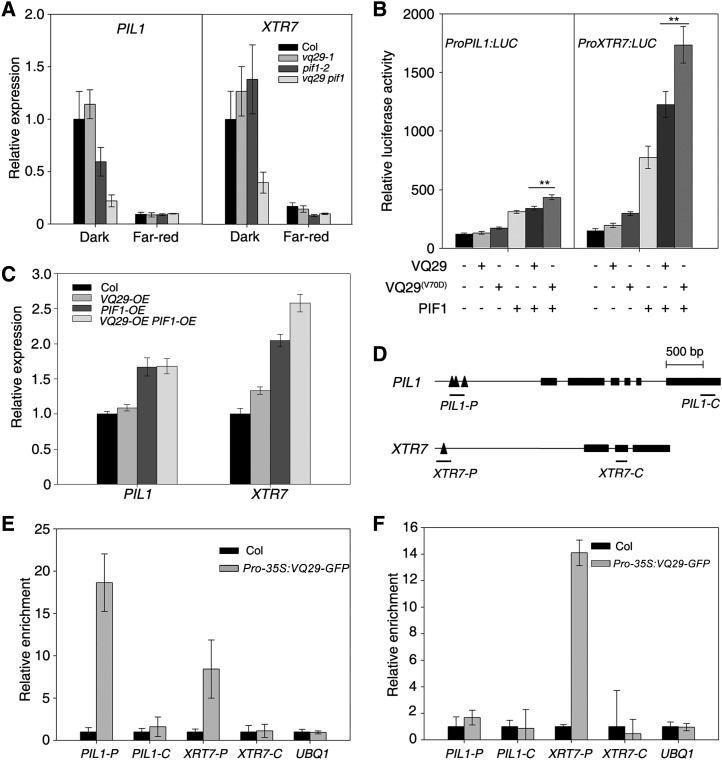
VQ29 and PIF1 coregulate downstream gene expression. A, Relative expression of PIL1 and XTR7 by quantitative RT-PCR. Seedlings were grown in darkness for 4 d and then kept in darkness or transferred to far-red light (12 µmol m−2 s−1) for an additional 1 h. Error bars indicate the sd of triplicates. B, Relative LUC reporter activity in Arabidopsis protoplasts cotransformed with the effector constructs. The LUC gene was under the control of either the PIL1 or XTR7 promoter. Data represent means ± sd of triplicates. Asterisks indicate significant differences at P < 0.01 using Student’s t test. C, Relative expression of PIL1 and XTR7 in VQ29 and/or PIF1 overexpression plants by quantitative RT-PCR. Seedlings were grown in darkness for 5 d. Error bars indicate the sd of triplicates. D, Diagram of the genomic structures of PIL1 and XTR7. Rectangles denote exons, and triangles represent G-box motifs. Amplicons used in the ChIP assay are underlined. E and F, ChIP-quantitative PCR assay showing the relative enrichment of fragments corresponding to the promoters or coding regions of PIL1, XTR7, and the UBQ1 control. DNA was precipitated with anti-GFP antibody in Pro-35S:VQ29-GFP (E) or with anti-MYC antibody in Pro-35S:TAP-PIF1 (F) transgenic plants. Data represent means ± sd of triplicates.

