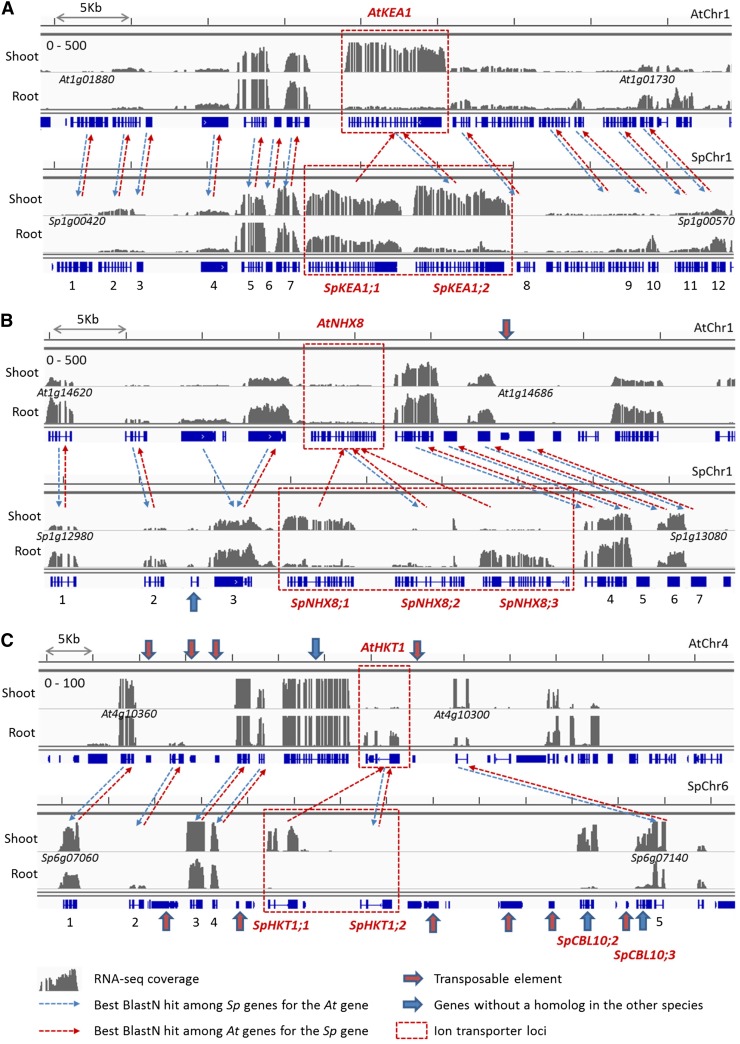
Figure 4.
TD of ion transporter genes in S. parvula. RNA-seq read coverage landscapes and homologous gene pairs are shown for colinear genomic regions of Arabidopsis (top) and S. parvula (bottom) around AtKEA1 (At1g01790) and SpKEA1;1 (Sp1g00490)/SpKEA1;2 (Sp1g00500; A), AtNHX8(At1g14660) and SpNHX8;1 (Sp1g13020)/SpNHX8;2 (Sp1g13030)/SpNHX8;2 (Sp1g13040; B), and AtHKT1 (At4g10310) and SpHKT1;1 (Sp6g07110)/SpHKT1;2 (Sp6g07120; C) loci. Gray histograms indicate normalized genome coverage by RNA-seq reads for shoot and root samples. Gene and putative transposon models are presented in blue below each histogram. For each gene in S. parvula and Arabidopsis, dashed arrows connect the homologous gene with the best BLASTN hit scores among all gene models in the genome of the other species. Ion transporter genes tandemly duplicated in S. parvula are marked as red dashed boxes. Putative transposons and gene models unique to either species are indicated by red and blue arrows, respectively. Detailed information on numbered homologous gene pairs, including quantified expression values, is presented as Supplemental Table S6. [See online article for color version of this figure.]

