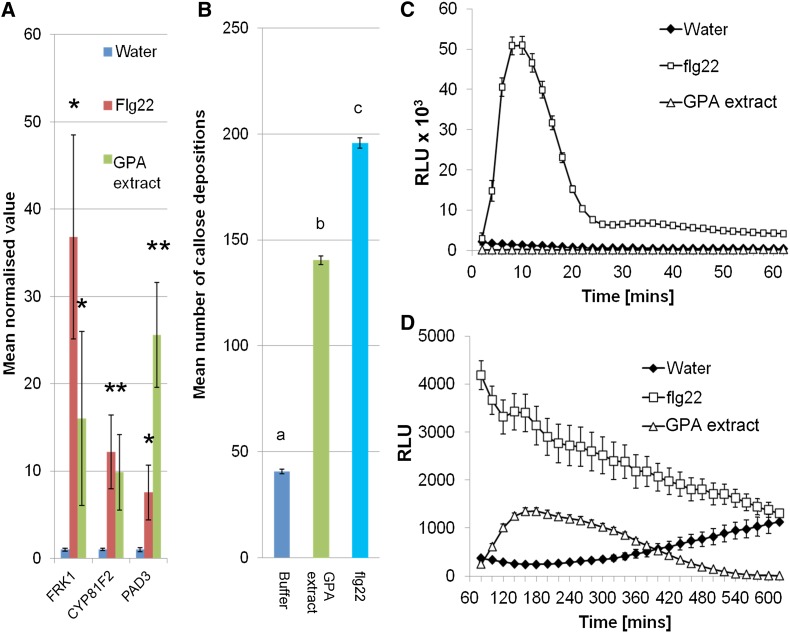
Figure 1.
Plant defense elicitations to GPA-derived extract are characteristic of PTI. A, GPA-derived extract elicits the expression of PTI marker genes. Bars show the means ± se of target gene expression levels of four independent experiments (n = three per experiment). Asterisks indicate significant differences in GPA fraction compared to water (Student’s t probabilities calculated within GLM), with *P < 0.05 compared to water control for each gene and **P < 0.05 between flg22 and GPA-derived extract treatment. B, GPA-derived extract elicits callose deposition. Data shown are mean callose deposits produced per 1.34 mm2 of leaf upon each treatment with means ± se of three independent experiments (n = 12 leaf discs per experiment). Different letters indicate significant differences between the treatments (Student’s t probabilities calculated within GLM) at P < 0.05 (n = 36, F2,103 = 2039.93). C and D, Col-0 leaf discs were elicited with water, 12.5 nm flg22 (in water), and GPA-derived extract (in water), and ROS bursts in these leaf discs were measured using luminol-based assays at 0 to 60 min (C) and 60 to 600 min (D) after elicitation. Graphs show means ± se of n = 32 leaf discs per replicate. Data of one representative experiment are shown. The experiment was repeated three times with similar results. RLU, Relative light units. [See online article for color version of this figure.]

