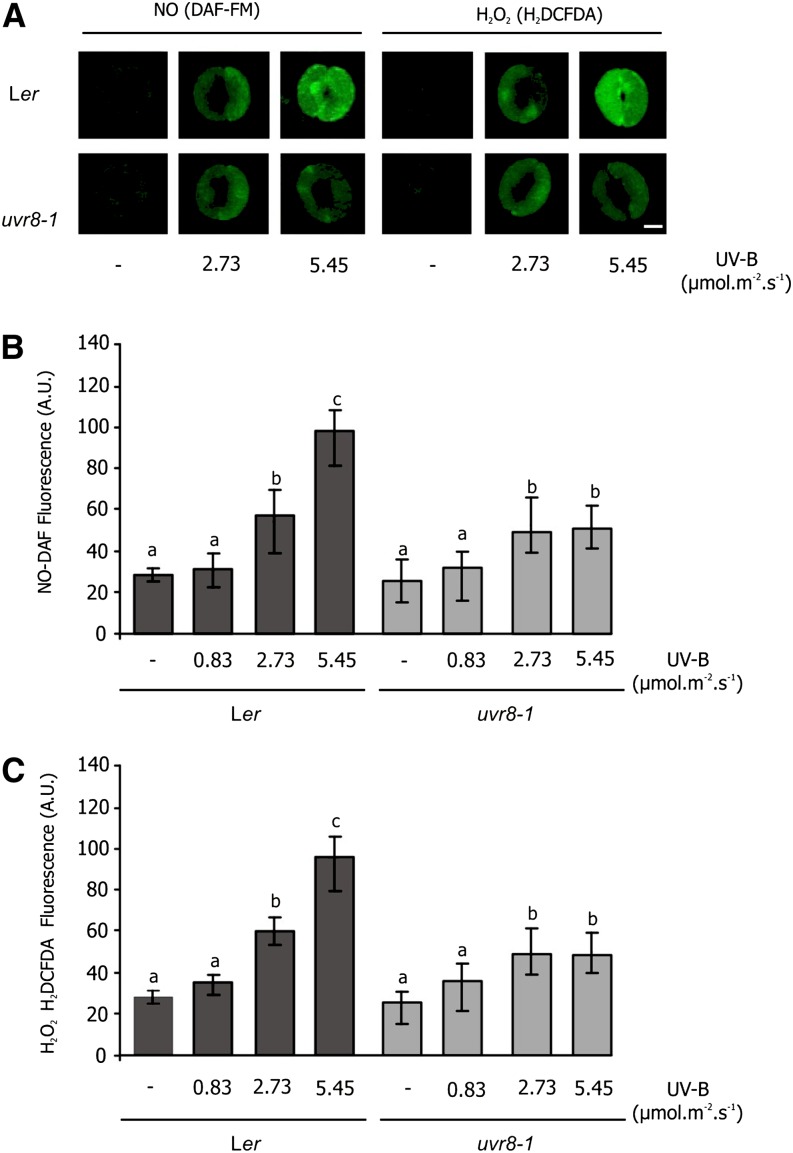
Figure 6.
Effect of increasing UV-B on NO and H2O2 levels in stomata of Ler and uvr8-1 plants. Epidermal strips of Ler and uvr8-1 plants were incubated in opening buffer and white light for 3 h and then exposed to different fluence rates of UV-B for 3 h. Strips were then incubated with 10 µm of the fluorescent probe DAF-FM-DA (for NO detection) or 10 µm of the fluorescent probe H2DCFDA (for H2O2 detection) for 10 min. A, Images of stomatal closure and NO and H2O2 fluorescence intensity. B and C, Quantification of pixel intensities for NO (B) and H2O2 (C) levels. Bar = 5 μm. Data are the average ± se of 60 to 90 stomata measured in three independent experiments. The letters denote significant differences from control at P < 0.05, according to one-way ANOVA. [See online article for color version of this figure.]

