Figure 2.
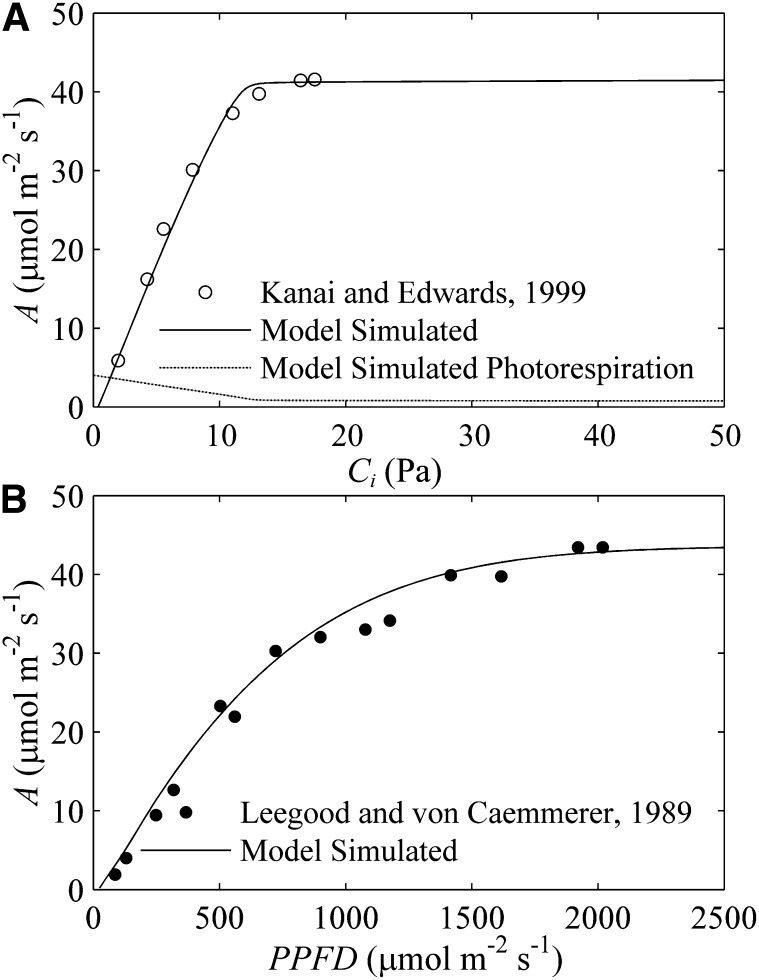
Model predicted photosynthetic CO2 uptake rate. A, The predicted photosynthetic CO2 uptake rate (A) versus intercellular CO2 concentration curve (Ci; black line) at a PPFD of 1,600 μmol m−2 s−1. The dotted line is the predicted photorespiratory rate. Circles are experimental data from Kanai and Edwards (1999). B, The predicted A versus PPFD curve. The black dots are experimental data from Leegood and von Caemmerer (1989).

