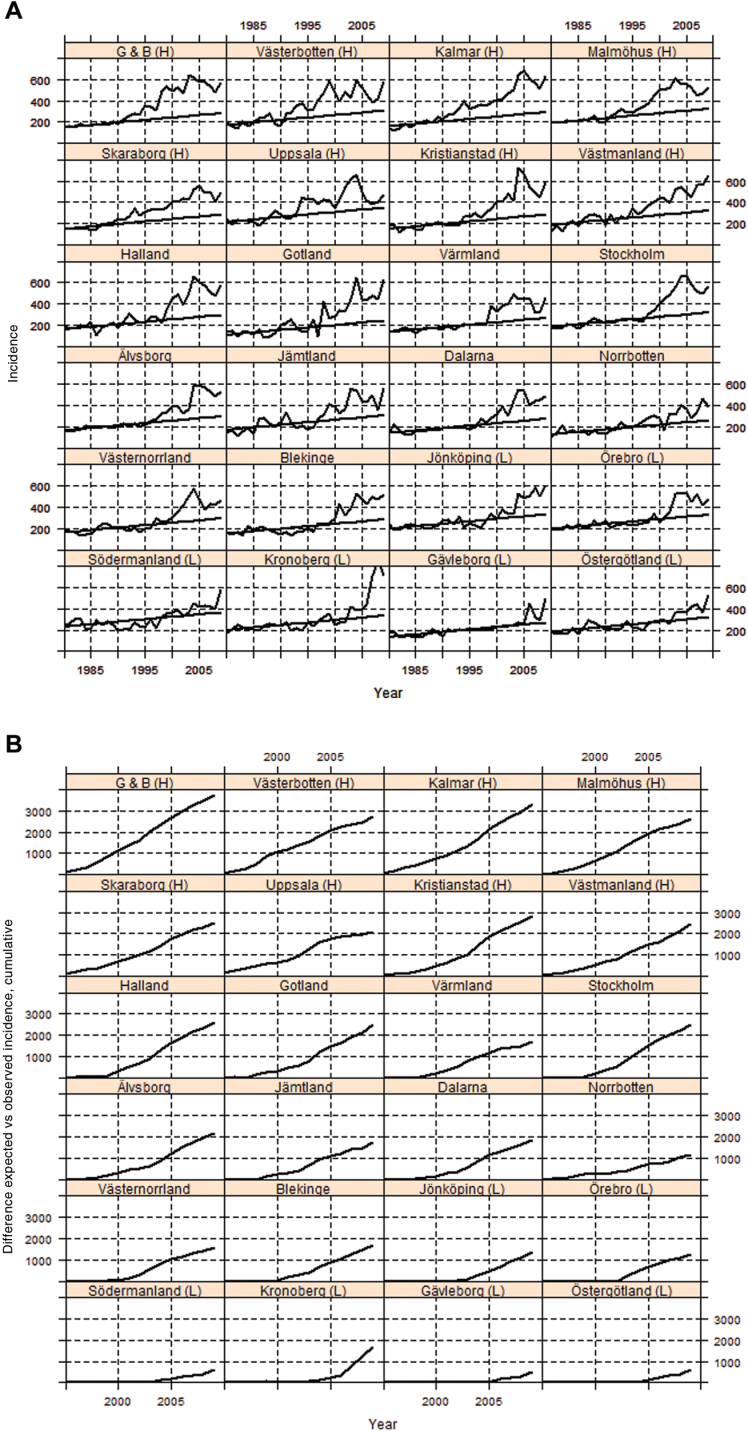
Figure 2.
Counties ranked by the cumulative difference between observed and predicted prostate cancer incidence per 100000 from 1995 through 2002. A) Observed and predicted age-standardized prostate cancer incidence in men aged 50–74 years in 24 Swedish counties during the period from 1980 to 2009. Steady line is predicted incidence, and undulating line is observed incidence. B) Cumulative difference between observed and predicted incidence of prostate cancer during the period from 1995 to 2009. Negative differences resulting from the predicted incidence being higher than the observed incidence in low-incidence counties were set to zero. G & B = Göteborg and Bohus county; H = high-incidence county; L = low incidence county.

