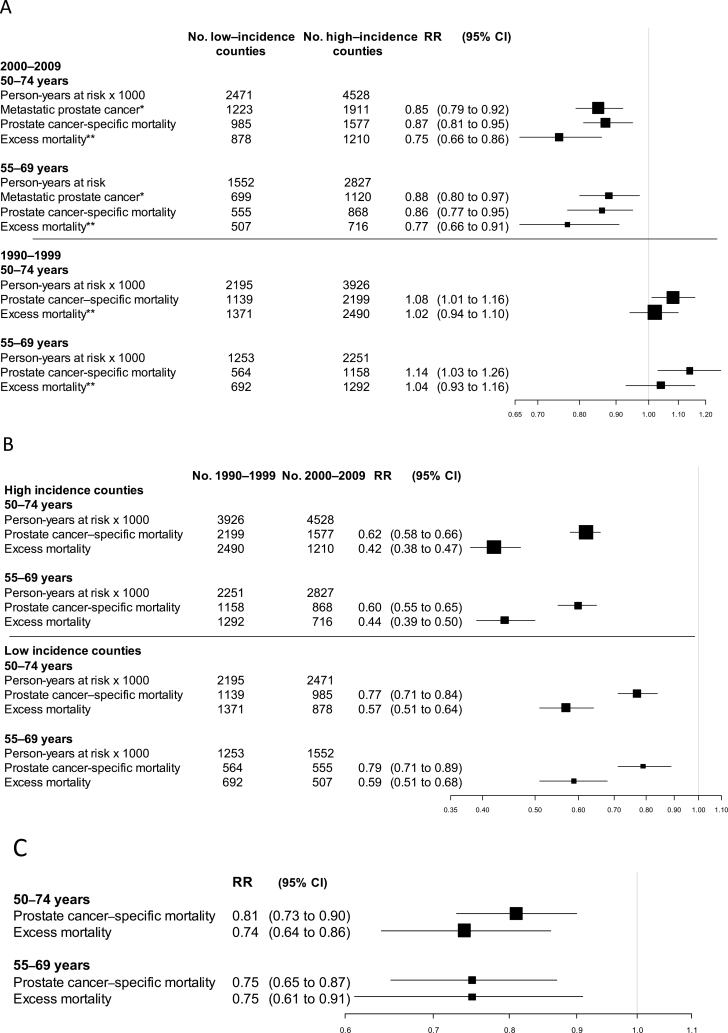
Figure 4.
Risk of prostate cancer mortality according to county of residency (in groups of counties with high and low incidence) and time period in groups of counties with high, intermediate and low incidence of prostate cancer A) Rate ratio (RR) of incidence of metastatic prostate cancer, prostate cancer–specific mortality, and excess mortality in high- vs low-incidence counties. B) Rate ratio of prostate cancer–specific mortality and excess mortality in the period from 2000 to 2009 vs the period from 1990 to 1999. C) Rate ratio for high- vs low-incidence group adjusted for time period. * Metastatic prostate cancer defined as M1 and/or prostate-specific antigen ≥ 100ng/mL at diagnosis. ** Excess mortality defined as the excess number of deaths (observed minus expected), regardless of cause of death among men with prostate cancer. CI = confidence interval.

