Fig. 1.

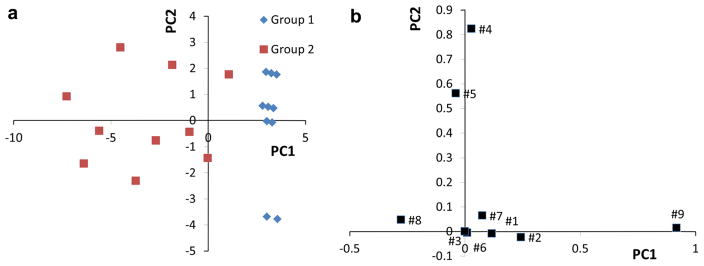
PCA of the artificial test dataset. The PCA scores plot (PC1 vs PC2) is shown in a and the corresponding PCA loadings plot is shown in b. The first two PCs explained 78.1 % of total variance including 63 % contribution of PC1

PCA of the artificial test dataset. The PCA scores plot (PC1 vs PC2) is shown in a and the corresponding PCA loadings plot is shown in b. The first two PCs explained 78.1 % of total variance including 63 % contribution of PC1