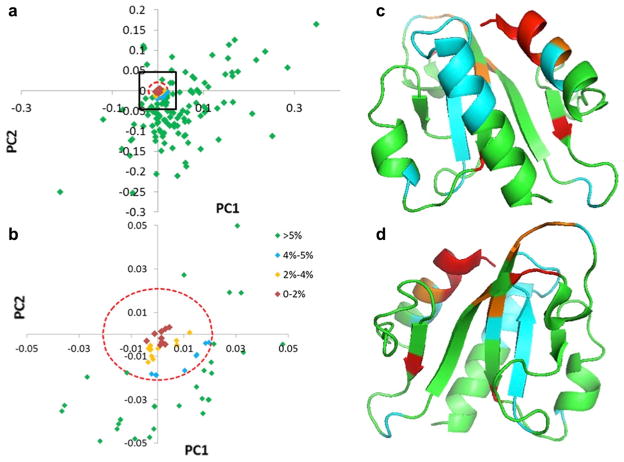
Fig. 7.
Analysis of the PCA loadings data for Pfam04327 to identify conserved residue positions. The PCA loadings plot (PC1 vs PC2) is shown in a and a zoomed-in view contained in the black box in a is shown in b. Euler distances to the centroid were calculated, and a distance equal to 5 % of the largest was used to filter the data (red broken-line circle). The ribbon rendering of a representative from Pfam04327 (PDB-ID: 3H9X) is shown in two different views in c and d (rotated by 180°) with the amino acid positions colored as indicated in the figure

