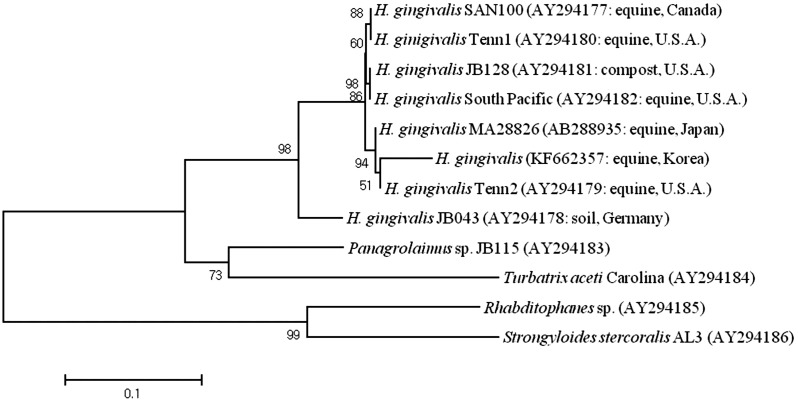
Fig. 6.
Maximum likelihood tree based on the LSU rDNA of the eight H. gingivalis and outgroups. Numbers in parentheses indicate the GeneBank accession number and the origin of the isolate. A statistical support was provided by bootstrapping over 1,000 replicates. The scale bar indicates 0.1 amino acid substitutions per site.

