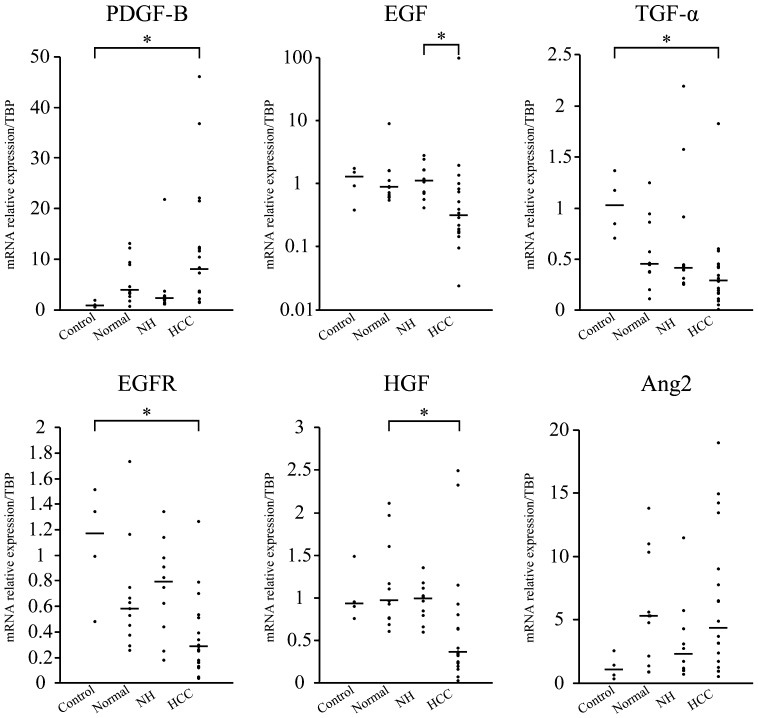
Fig. 2.
Distribution of the mRNA relative expression/TBP expression in control, normal, NH and HCC samples. Each bar represents the median value. The PDGF-B gene was upregulated, and TGF-α and EGFR genes were downregulated in HCC compared with controls (*P<0.05). EGF was downregulated in HCC compared with NH (*P<0.05). HGF was downregulated in HCC compared with the normal samples (*P<0.05). Ang-2 in HCC was not significantly different between dogs with NH and normal samples, although its expression was considered to be upregulated in normal samples.

