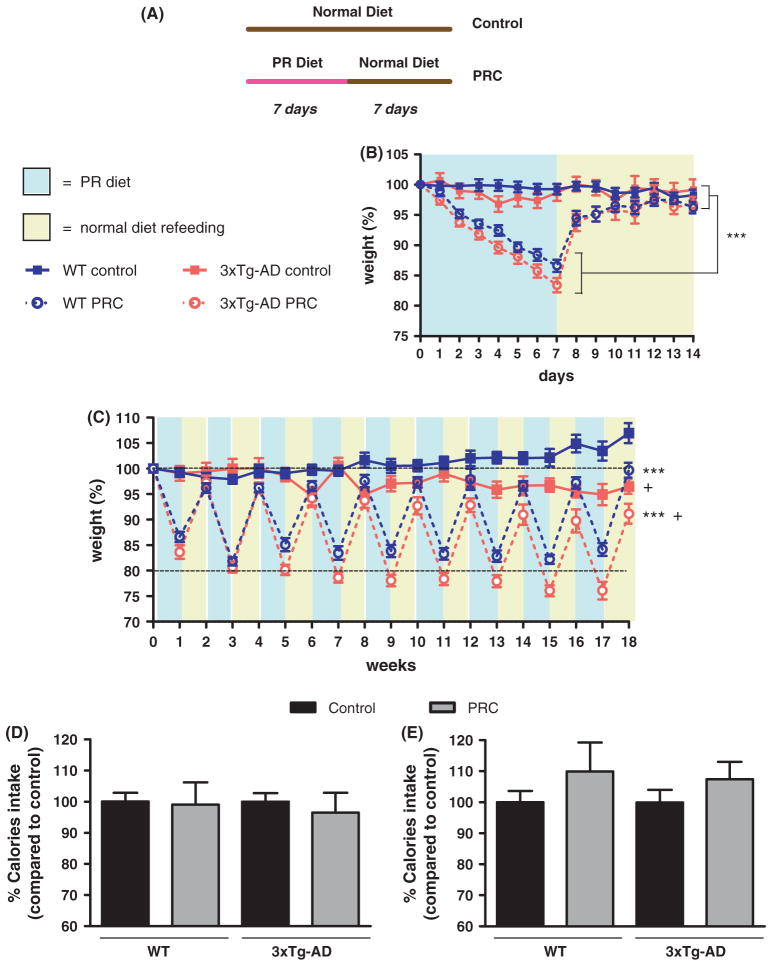
Fig. 1.
Body weight and calories intake profiles. (A) Diagram showing the Control and PRC dietary regimens used in the study. (B, C) Mouse body weights were measured and plotted as percentage of the initial weight scored at day zero (13–15 animals per group). The mice were weighed daily the first 2 weeks (B) and weekly for the remaining 16 weeks (C). (B) During the first 2 weeks of dietary intervention WT and 3xTg-AD mice subjected to PRC regimen showed a significantly different body weight profile when compared with corresponding controls (***P < 0.001). (C) The different body weight profile between WT and 3xTg-AD PRC groups and corresponding controls was maintained over the whole 18 weeks of dietary treatment (***P < 0.001). Moreover, we found a significant difference between body weight profiles of 3xTg-AD control and PRC groups and corresponding WT animals (+P < 0.05, 3xTg-AD control vs. WT control and 3xTg-AD PRC vs. WT PRC). (D, E) Calories intake normalized for grams of body weight was scored daily at the beginning (weeks 1 and 2, D) and at the end of the dietary treatment (weeks 17–18, E) and was expressed as percentage calculated for the combined 2 weeks of PR diet and normal diet refeeding.

