
Figure 3. Interactions between liposomes and peptide amphiphiles.
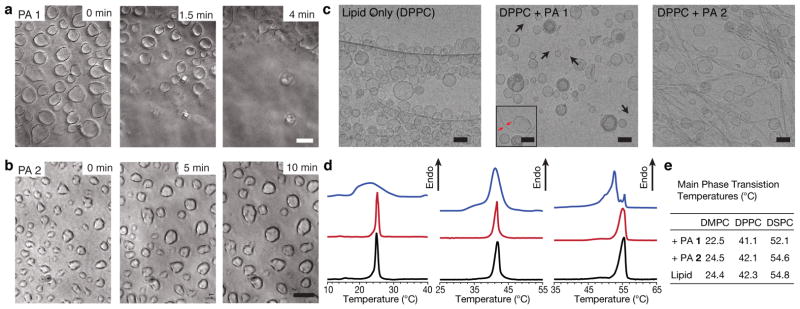
Time-lapse phase contrast microscopy of giant liposomes exposed to either (a) PA 1 or (b) PA 2. Time-points are indicated in the upper right corner. Scalebars: 10 μm. (c) Cryogenic TEM of extruded DPPC liposomes (100 nm diameter) and mixtures with either molecule PA 1 or PA 2 Inset: A less representative image of DPPC with PA 1 where a nanofibre is observed interacting with a liposome (black arrows: bicelles, red arrows: nanofibre,). Scalebars: 100 nm. (d) Differential scanning calorimetry of liposome-PA 1 mixtures (blue), liposome-PA 2 mixtures (red) and liposomes alone (black) where the lipid component is comprised of DPPC (left), DMPC (middle) or DSPC (right). (e) Values of the gel-liquid crystalline phase transition temperatures from each DSC sample.