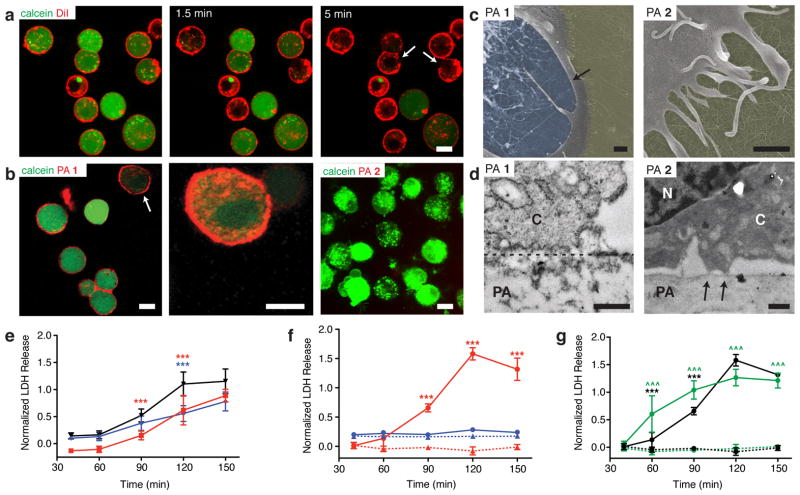
Figure 4. Cell response to PA with varied β sheet hydrogen bonding.
(a) Confocal live cell imaging of cells treated with a membrane dye (DiI, red) and calcein (green) to visualize viability over time on coatings of PA 1. Scale bar: 10 μm. Discontinuities in the cell membrane are indicated by arrows. (b) Confocal images of calcein-treated cells cultured on coatings of fluorescently labeled PA 1 (left) and higher magnification of the cell indicated by the arrow (center). Calcein-treated cells cultured on coatings of fluorescently labeled PA 2 (right) Scalebars: 10 μm. (c) Scanning electron micrographs of cells on coatings of PA 1 and PA 2 after 30 minutes (yellow: coating surface, blue: internal surface of cell, no color: outer cell surface). Scalebars: 500 nm. Arrow indicates the ruptured cell membrane. (d) Transmission electron micrographs of cross sections through both the cell and PA coating to reveal interactions between the cell and coating (C: cytoplasm, N: nucleus, PA: PA coating) after 30 minutes of culture (dashed line: interface between cell and PA coating, arrows: distinct sites of cell attachment to PA coating). Scalebars: 500 nm. (e–g) Time dependent measurement of lactate dehydrogenase (LDH) release: (e) LDH release after inhibition of actin (blue) or myosin (red) were compared to untreated controls (black); (f) LDH release from cells cultured at either 37°C (red) on coatings of PA 1 (circles, solid line) or PA 2 (triangles, dotted line). Cells were also cultured at 4°C (blue) on PA 1 (circles, solid line) or PA 2 (triangles, dotted line); (g) LDH release from cells depleted of ATP (green) and cultured on coatings of PA 1 (solid line) or PA 2 (dotted line) were compared against control (black) cultures on PA 1 (solid line) or PA 2 (dotted line) coatings. Statistical analysis: Two-way ANOVA with a Bonferroni post test: ***p < 0.001, treatments compared against their respective controls; ^^^p < 0.001, PA 1 compared against PA 2.

