
FIGURE 1.
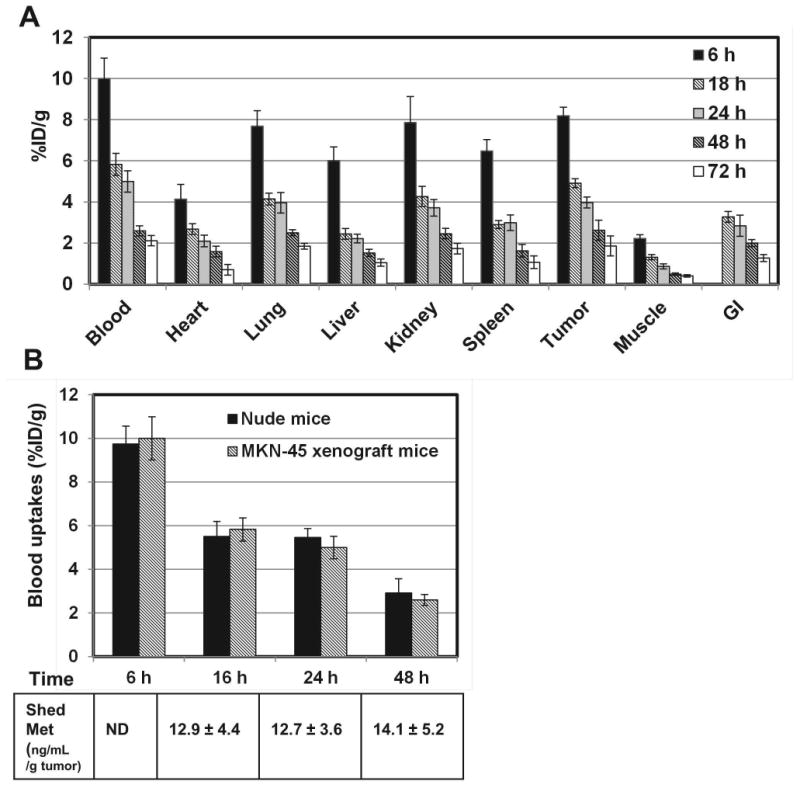
A) Biodistribution of 76Br-Onartuzumab in MKN-45 xenografts from 6 to 72 h. Each time point represents the mean %ID/g ± SD of 76Br-Onartuzumab (n=3 for 72 h group; n=4 for all other time points). B) Comparison of 76Br-Onartuzumab blood uptakes (%ID/g) in nude and MKN-45 xenograft mice. Each time point represents the mean %ID/g ± SD of 76Br-Onartuzumab (nude mice, n=5; MKN-45 xenografts, n=4). The table below are the corresponding plasma shed Met ectodomain concentrations (ng/mL/g tumor) determined from the same MKN-45 xenograft mice blood samples; each value represents the mean concentration ± SD (n=4; ND-not determined).