
FIGURE 3.
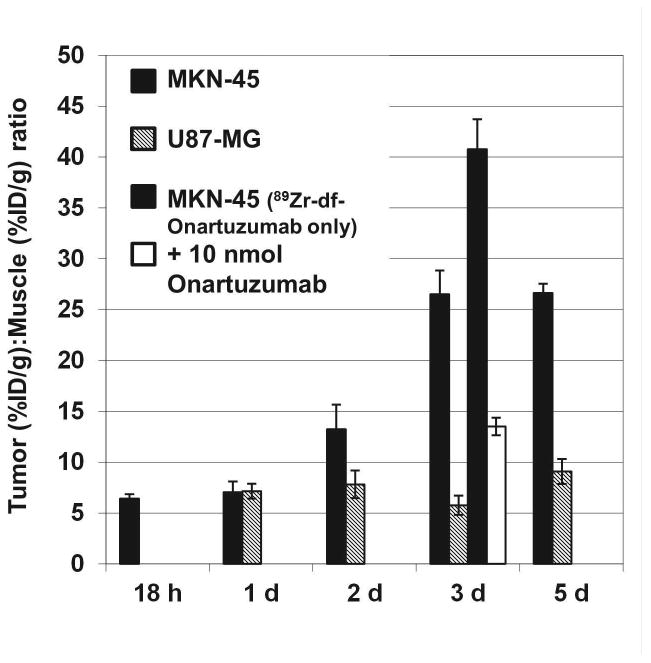
Comparison of Tumor (%ID/g):Muscle (%ID/g) Ratios (T:M) of 89Zr-df-Onartuzumab in MKN-45 and U87-MG xenografts from 18 h to 5 d. Bars represent mean T:M ± SD (n= 4). Bars at 3 d include T:M from 89Zr-df-Onartuzumab competitive blocking study in MKN-45 xenografts injected with 89Zr-df-Onartuzumab only or 89Zr-df-Onartuzumab + 10 nmoles Onartuzumab.