
FIGURE 7.
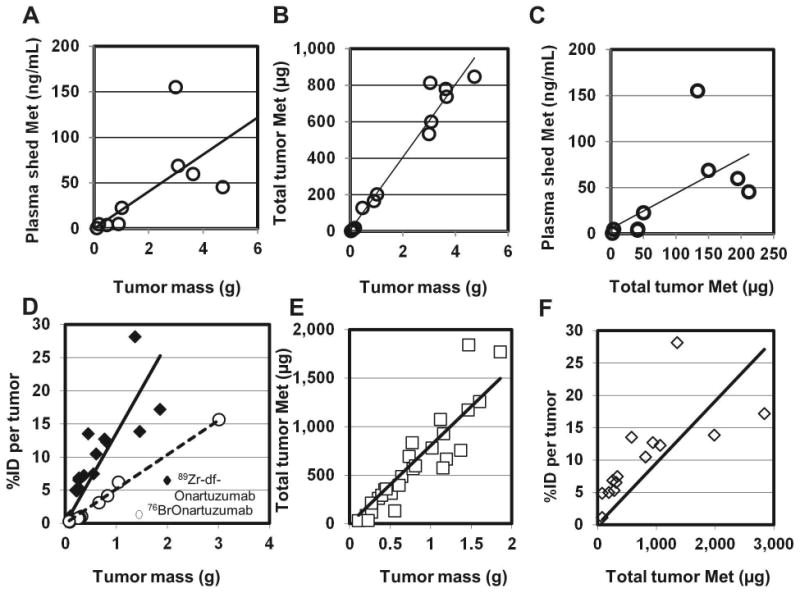
Correlation of plasma shed Met, total Met tumor content, and radioactive tumor uptake (%ID per tumor) with tumor mass and Met abundance (all correlations determined using Spearman non-parametric analysis, r= Spearman r). A-C) Correlations of plasma and tumor samples from naïve MKN-45 xenografts: A) r = 0.8167; P< 0.02; B) r=0.9321; P<0.0001; C) r = 0.8167; P< 0.01. D-F) Tumor samples from MKN-45 xenografts previously injected with radiolabeled MetMAb: D) Correlations of radiolabeled Onartuzumab tumor uptake to tumor mass: 76Br-Onartuzumab (○): %ID per tumor determined after 24 h (r = 0.9879; P<0.0001); 89Zr-df-Onartuzumab (◆): %ID per tumor determined after 3, 4, and 5 d(r = 0.9357; P<0.0001); E) Correlation of total tumor Met to mass: tumor samples were taken after 0.75, 1, 2, 3, 4 and 5 d of 89Zr-df-Onartuzumab uptake and assayed for total Met content (r = 0.9721; P<0.0001); F) Correlation of 89Zr-df-Onartuzumab tumor uptake (%ID per tumor after 3, 4, and 5 d of uptake) to total tumor Met determinations (r = 0.9385; P<0.0001).