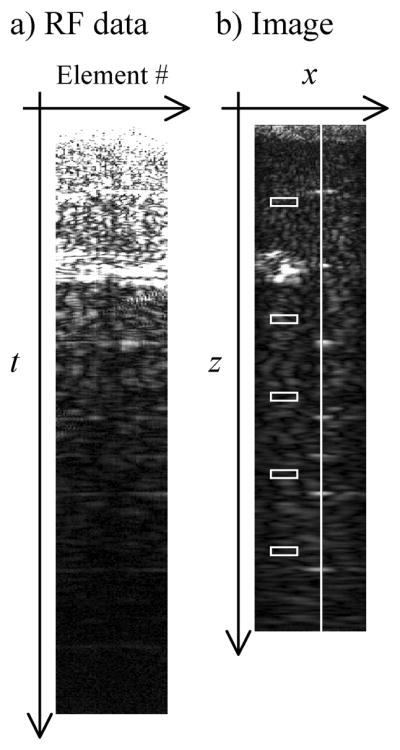
Fig. 1.

a) Raw RF data in the element vs. time space, called e-t space here, can be reconstructed into the image shown in (b) using a regular delay-and-sum beamforming reconstruction. Note that the carrier frequency of the raw signal was removed in (a) for display purposes, as it would be difficult to capture using limited resolution in a small figure (the raw data was made complex and a magnitude operator was applied). Regions of interest are defined here in (b) for later use (white boxes and line).
