Fig. 4.

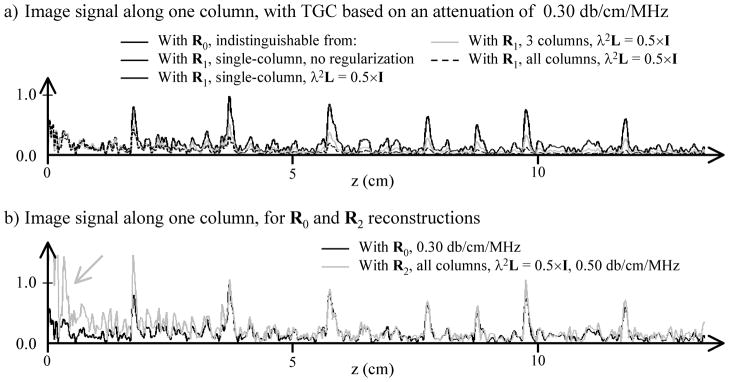
A single column from a phantom image, highlighted in Fig. 1b, is plotted here for different reconstruction algorithms and settings. a) When reconstructing one column at a time, our modified reconstruction from Eq. 6 gives results that are essentially identical to the delay-and-sum beamforming reconstruction from Eq. 1 (black solid line). As more columns are included into the reconstruction, our method diverges from delay-and-sum beamforming (gray solid and black dashed lines). b) With all columns included into the reconstruction, the TGC must be changed from 0.30 to about 0.50 db/cm-MHz to restore the magnitude at greater depths. The nominal attenuation value for this phantom is 0.50±0.05 db/cm-MHz, in good agreement with the TGC compensation required with our method. However, signal becomes overcompensated at shallow depths (gray arrow). The plots use a linear scale, normalized to the maximum signal from the curve in (a).
