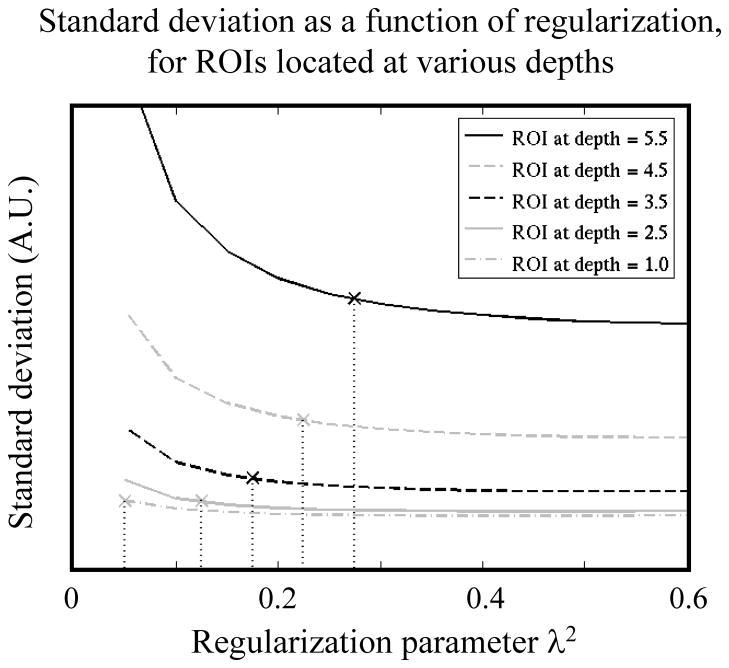
Fig. 5.
A 50-frames dataset was reconstructed several times, with different settings for the regularization parameter λ2. The standard deviation across all 50 frames was taken as a measure of noise, and averaged over the 5 ROIs shown in Fig. 1b. With d = z/wprobe, the ROIs were located at a depth of d = 1.0, 2.5, 3.5, 4.5 and 5.5. For each ROI, the standard deviation is plotted as a function of the regularization parameter λ2, and a ‘×’ mark indicates the λ2 = d/20 setting selected here.

