
Fig. 2.
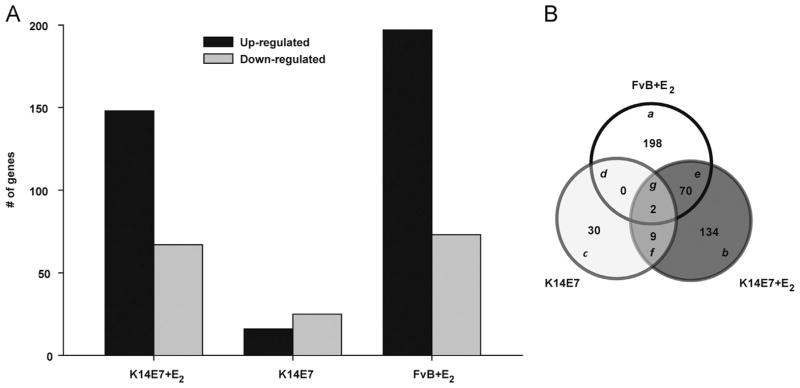
Global expression profile of K14E7+E2, K14E7 and FvB +E2 mice vs untreated FvB mice, respectively. To determine the differentially expressed genes, a fold change of ≥2 and ≤−2, and a p-value cutoff of <0.05 were used. (A) 148, 16 and 197 up-regulated genes and 67, 25 and 73 down-regulated genes in K14E7+E2, K14E7 and FvB +E2 mice vs untreated FvB mice were detected, respectively. (B) The Venn diagram shows unique ((a)–(c)) and common ((d)–(g)) differentially expressed genes between the K14E7+E2, K14E7 and FvB +E2 groups.