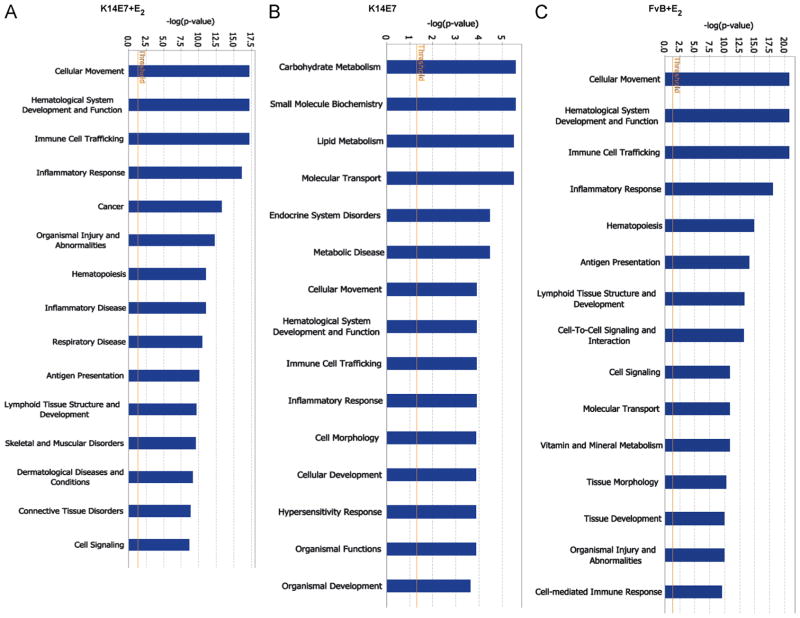
Fig. 3.
Gene ontology-based biological process pathways. For each experimental mice group, the genes were categorized into functional groups by the Ingenuity Pathway Advanced (IPA) software. Closed bars indicate—log (p-value), which was calculated by the IPA software showing the levels of relatedness. The left Y-axis shows the—log (p-value), and the X-axis indicates the name of functions.

