Figure 1.
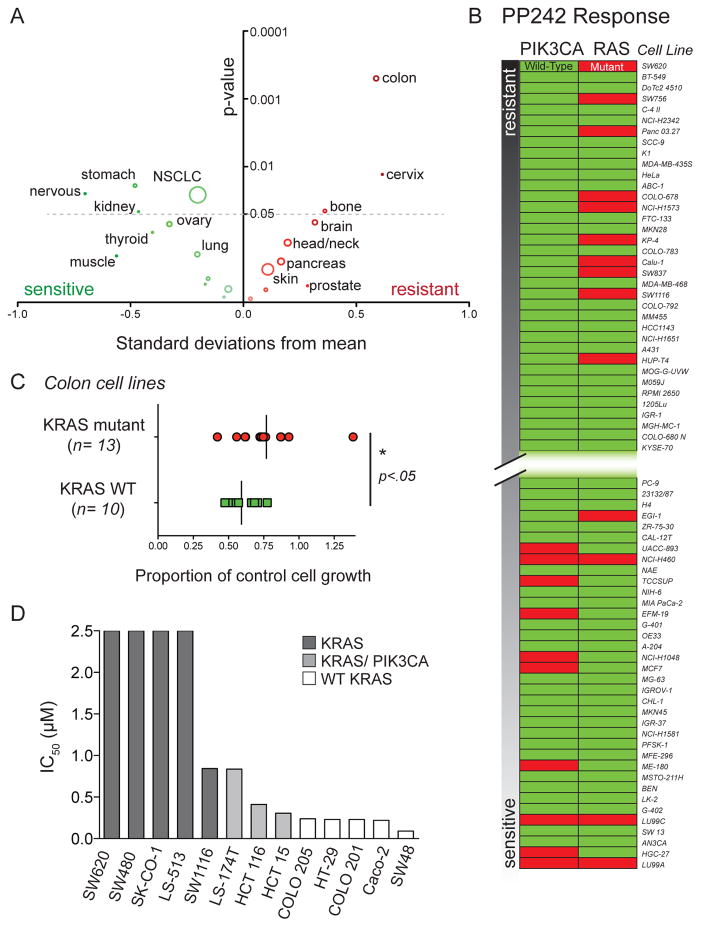
An unbiased cell screen reveals factors leading to resistance and sensitivity to the ATP-competitive mTOR inhibitor PP242 (A) Colon cell origin is a strong predictor for resistance to PP242 treatment. The mean response of each cell type to 500 nM PP242 treatment was plotted as a standard deviation from the population mean. The y-axis indicates the significance of the test-statistic for each independent difference in means (cell type versus population). The size of the circle corresponds to the number of cell lines of each type analyzed. Colon origin (n=39) was the strongest single predictor of resistance or sensitivity to PP242 among all annotated organ types. (B) PIK3CA mutations are prevalent in cell lines sensitive to PP242 while RAS marks cell lines that are resistant to PP242. The set of 357 cell lines with known mutation status for PIK3CA and RAS were assayed for growth inhibition and ranked according to the inhibition results. The 10% most resistant and most sensitive cell lines are shown here in order of increasing response to PP242. (C) KRAS mutant colorectal cells are more resistant to PP242 than cells harboring WT KRAS. Comparison of means was made using Student’s t-test. (D) IC50 values for PP242 in selected colon cancer cell lines. KRAS mutant cell lines with concomitant PIK3CA mutations are more sensitive to PP242 than KRAS mutants alone.

