Figure 5.
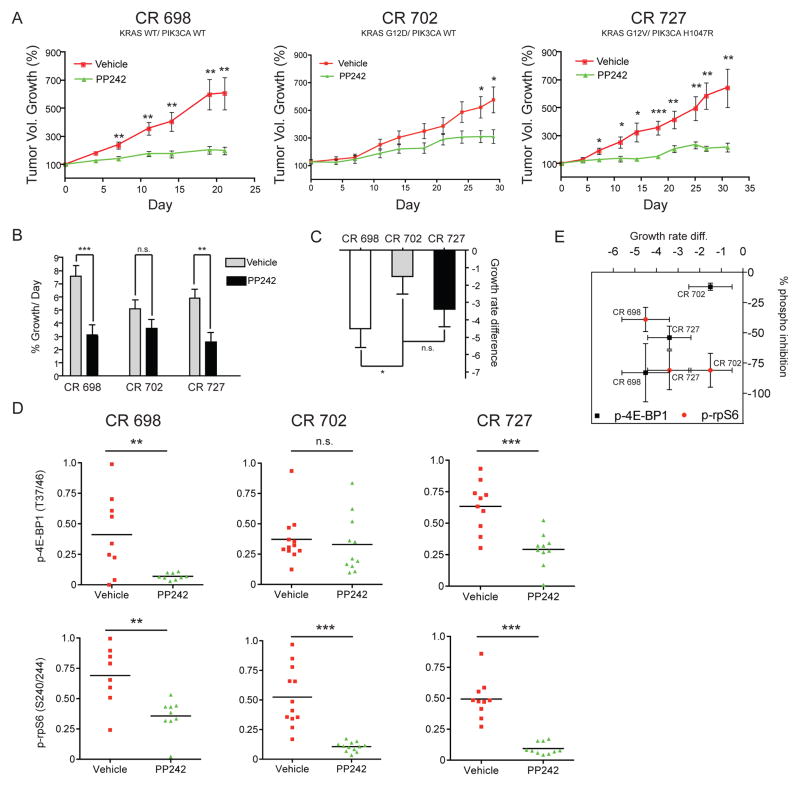
KRAS mutant patient-derived xenografts are resistant to PP242 by incomplete inhibition of 4E-BP1 phosphorylation. (A) Percent growth curves of three xenografts show differences in response to PP242 treatment. KRAS and PIK3CA genotypes are as follows: CR 698 (KRAS WT/PIK3CA WT), CR 702 (KRAS Mut/PIK3CA WT), CR 727 (KRAS Mut/PIK3CA Mut). Mice were given 100 mg/kg PP242 once daily or vehicle for the indicated time. Tumors were normalized to 100 percent at the beginning of dosing and percent growth ±SEM was plotted for each day when tumor volume measurements were taken. Asterisks indicate significant differences in tumor growth at each measurement point as determined by an unpaired t-test (* p< .05, ** p< .01, *** p< .001). (B) Treatment effect is significant in tumors CR 698 and CR 727. Tumor growth rates were calculated using a linear mixed effects model. PP242 led to a significant reduction in growth rate as calculated using a Wald test (asterisks represent the same p values as in A) in the KRAS WT tumor CR 698 and the double mutant tumor CR 727, but not the KRAS single-mutant tumor CR 727. (C) PP242 is most effective at inhibiting growth of the KRAS WT tumor CR 698. Comparison of the growth rate difference calculated from the model shows that PP242 is significantly more effective at inhibiting growth in CR 698 than in CR 702. The growth rate difference is the growth rate of the PP242 treated tumors minus the control growth rate. All other comparisons were not statistically significant. (D) Whole-tumor western blots show that p-4E-BP1 levels were significantly more reduced by PP242 treatment in KRAS WT and KRAS/PIK3CA double mutant tumors but not in KRAS single-mutant tumors. After treatment with either PP242 or vehicle for 30 days, tumors were removed and analyzed by western blot for phosphoprotein analysis. Bands were quantified by fluorescent antibodies and intensities internally normalized to those of β-actin. Intensities are reported as arbitrary normalized fluorescence units. Statistical comparisons were made using two-tailed t-tests as in Figure 3A. (E) Changes in p-4E-BP1 but not p-rpS6 correlate with changes in tumor growth. A plot of the tumor growth rate difference (Figure 5C) versus percent inhibition of p-4E-BP1 and p-rpS6 shows that the efficiency in inhibiting 4E-BP1 phosphorylation correlates linearly with the percent growth defect between treated and untreated tumors. Percent inhibition of p-rpS6 does not vary significantly with genotype or tumor growth defect as calculated from linear mixed effects model.

